YOUR WEEKLY ROADMAP
This week is the official start to March Madness for college basketball fans. However, for us stock market fans, the madness in the form of a bull run has been going on since the end of October.
The S&P 500 was about to close higher for the 17th time in the last 19 weeks! That had NEVER happened. As a result of a Friday reversal, we closed down moderately for the week and didn't reach that rarified air.
However, we did make our 16th new closing high for the year on Thursday and every time we get a minor sell off we quickly recover as seen by the fact that the index has gone 91 days without a 2% pullback. That is the 4th longest streak of its kind since 1965.

Will the market madness continue this week? Will the Friday reversal in many of the high flying tech stocks be a harbinger of tougher times ahead? Can we keep that streak of days without a -2% retracement intact?
We believe a pause to the rally is imminent, but that’s what makes this job exciting - you never know what comes next.
We could get many of those questions answered this week. So let’s focus on what traders will be watching now that earnings season is officially over. That primary focus will come in the form of economic data in the CPI and PPI. Let’s dive into that and other indexes to watch.
Consumer Price Index (CPI) continues to be the one inflationary number that consistently moves the market. Last month the number came in hotter than expectations (3.1% vs an expected 2.9%) and the S&P 500 sold off -1.6%. While the sell-off was short lived, the knee jerk reaction to the hotter number was quite negative.
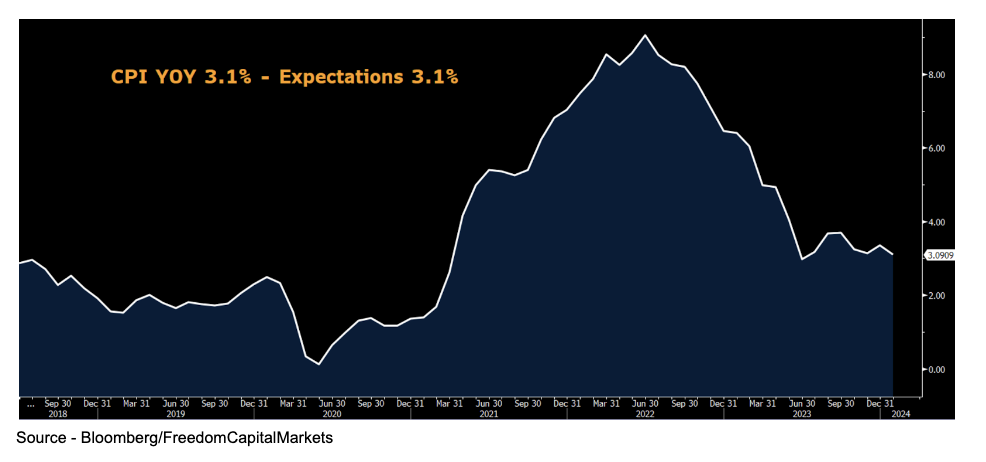
The year-over-year numbers have stabilized which is good, but now the Fed wants to see it tick lower. Economists anticipate headline CPI - which includes food and energy - to remain stable. A cooler number may get rate cut talk back on the table, but a hotter number and the Fed’s pause may drag on.
S&P Equal Weighted Index Makes New Highs. Last week we broke the third longest streak without new highs in the Equal Weight S&P 500’s history. The streak lasted a total of 544 days. Thanks to my friend Todd Sohn of Strategas who shared this great fact on The Compound and Friends podcast.
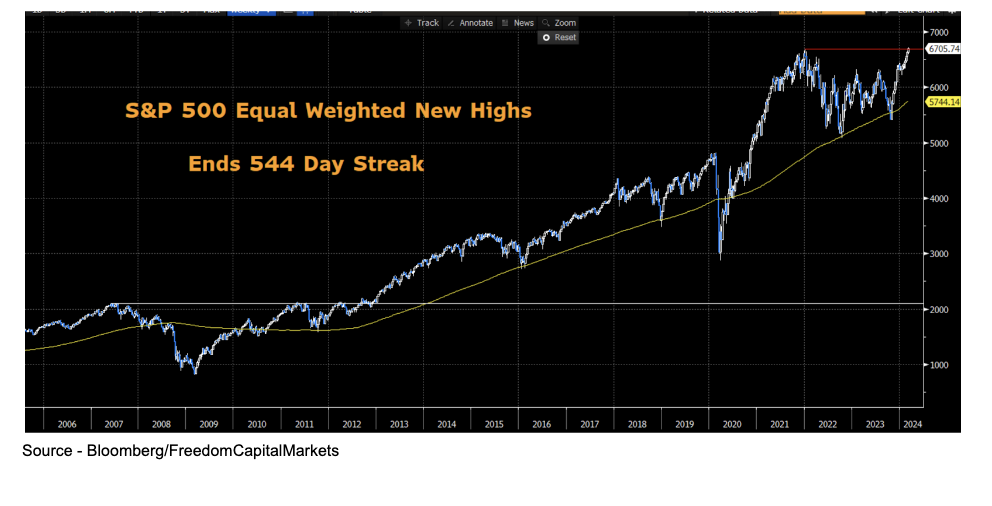
The equal weighted S&P 500 treats every stock within the index as the same. So those Magnificent 7 stocks that make up the majority of the weighting in the S&P 500 are treated the same as the smallest stock within the index. The overall strength now that the equally weighted index is at new highs, gives credence to the notion that the markets’ rally is truly broadening.
The stats for this index go back to 1990. The only streaks that were longer without a new high were during the Dot.com bust and the Great Financial Crisis. Clearly this development is not bearish.
Sector to Watch - Materials (XLB)
The Material sector has been on a tear lately. It’s up 21% since its October low, but is now just breaking out to new all-time highs.
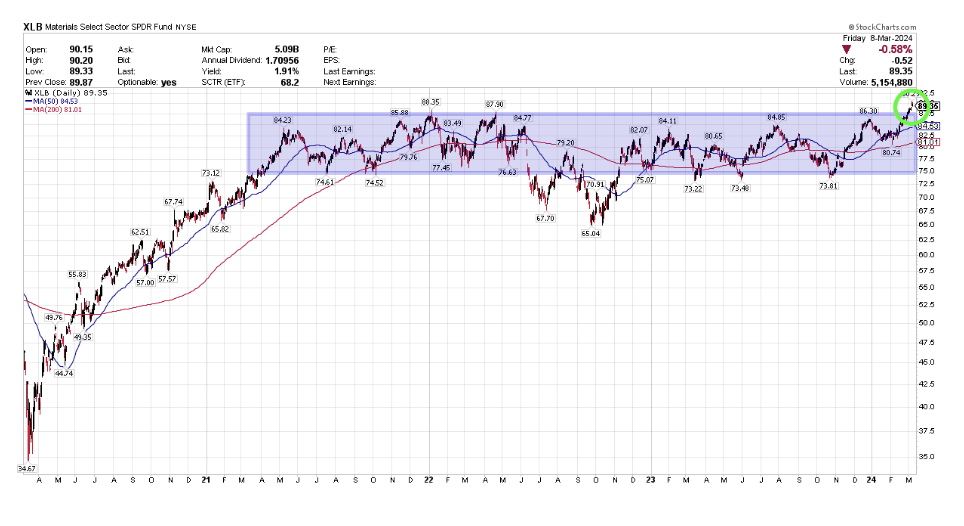
The sector, with the exception of a six month stretch in 2022, had been in an extremely long and neutral trading range going back to early 2021. This recent breakout to new highs is verification of a rotational trade that you want to see in a secular bull market. I discussed that rotational change on CNBC last week.
The narrative of just a select group of stocks or tech heavy sectors leading the way has changed. When we see breakouts like this, it confirms that change. We’ve seen breakouts in Industrials (XLI), Healthcare (XLV), and Financials (XLF) already as things continue to broaden out.
When looking at key stocks within the XLB, the leader is clearly Linde (LIN) which constitutes 22% of that ETF. However, strong technical moves and rebounds in Sherwin Williams (SHW), Ball Corp (BALL), Dow Chemical (DOW), and Vulcan Materials (VMC) are a testimony that the rally is just starting in the sector and the rotation into it is in its early innings.
Earnings. There are still a few stragglers worth watching this week, despite the official end to earnings season. Among them are…
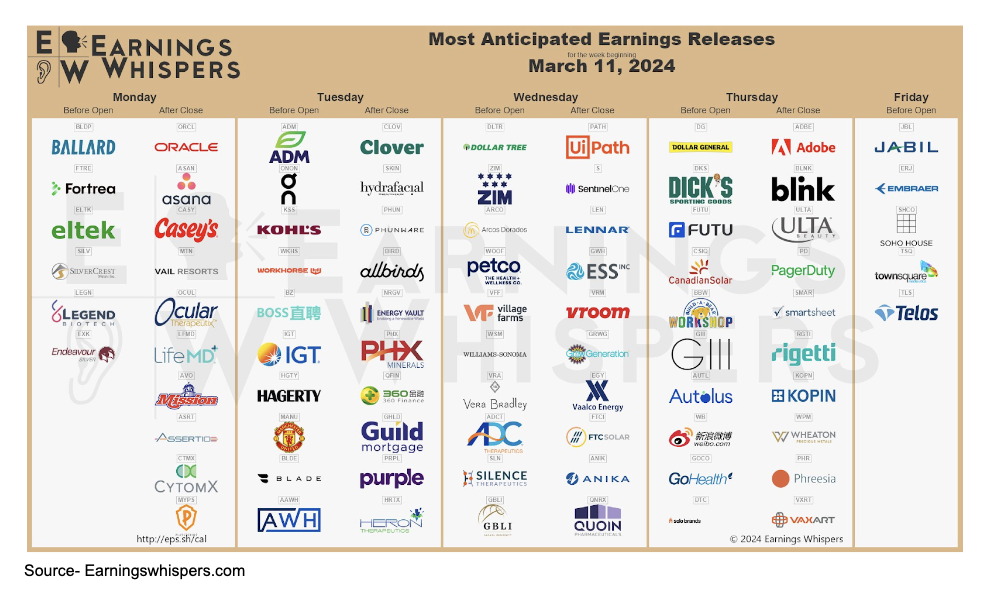
Stocks in Focus…
Oracle (ORCL) shares are trading roughly 10% off their 52-week highs and have been consolidating in a narrow range as they head into the Monday afternoon report.
All eyes will be focused on their cloud infrastructure business and AI growth. Shares gapped lower in December due to slowing revenue growth. They have missed on that metric the last two quarters and have yet to rebound.
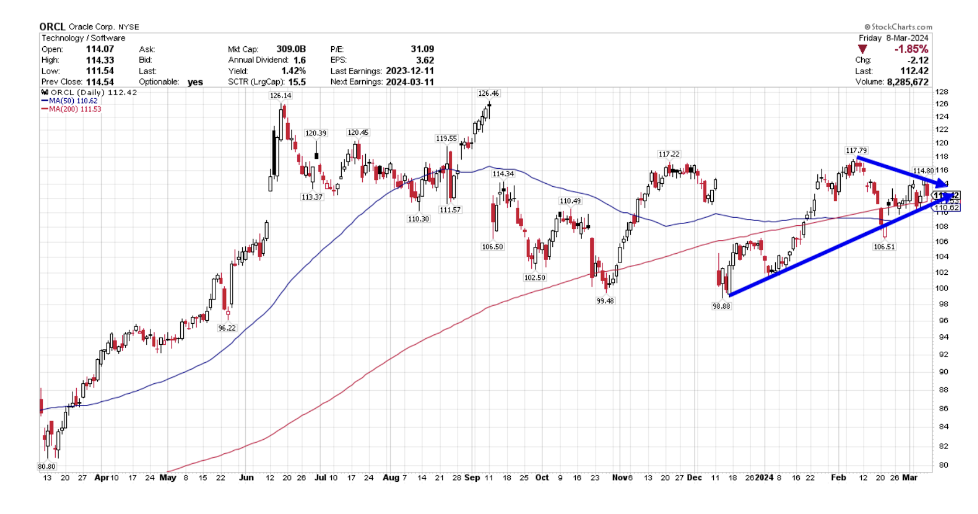
Technically, the stock is ready to move. If they report a disappointing outlook, watch those December lows around $99 for support. If the stock acts well on the news, the first level of resistance is just under $118. Bulls would like to see a breakout above that level. If they can achieve that mark, then a run to the old highs should be in sight,
Petco Health and Wellness (WOOF). You know it's a slow week when we are featuring WOOF. But let’s be honest, it is one of the best stock symbols out there. Yet, staying honest, this has been a stock that has clearly gone to the dogs since going public on my birthday in 2021.
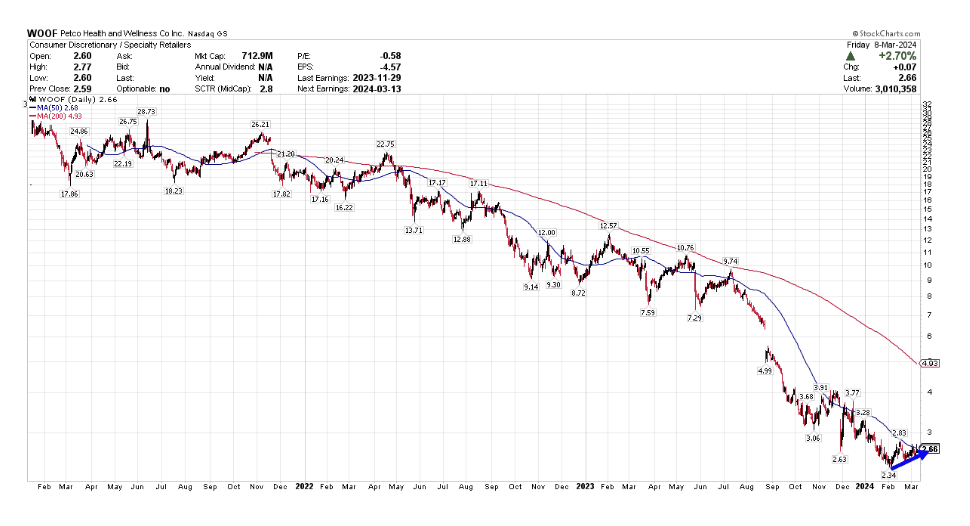
Looking at the chart since its IPO, shares had a euphoric rise during Covid, but it's been a slow and steady decline ever since. Shares have flattened out between $2.40 and $3.00 since the start of this year. The only small silver lining is its recent uptrend over the last month. Let’s see if that’s the start of something bigger.
Earnings haven’t been kind to the pet care giant as they have decreased EPS over the last four quarters. Over that span, the stock has fallen each time with an average loss of -21.3%. Shares hope to stop playing dead and fetch a nice bid when they report Wednesday. Watch that declining 50-day moving average as a guide on any trend reversal.
Adobe (ADBE) has been under tremendous pressure since peaking in early February. News of Microsoft-backed OpenAI’s plans to launch a competing text-to-video generator just months after Adobe’s introduced their own AI powered editing system put pressure on shares and they have yet to rebound.
Shares have fallen 17% since then and are trading at a very interesting technical threshold coming into Thursday’s earnings.
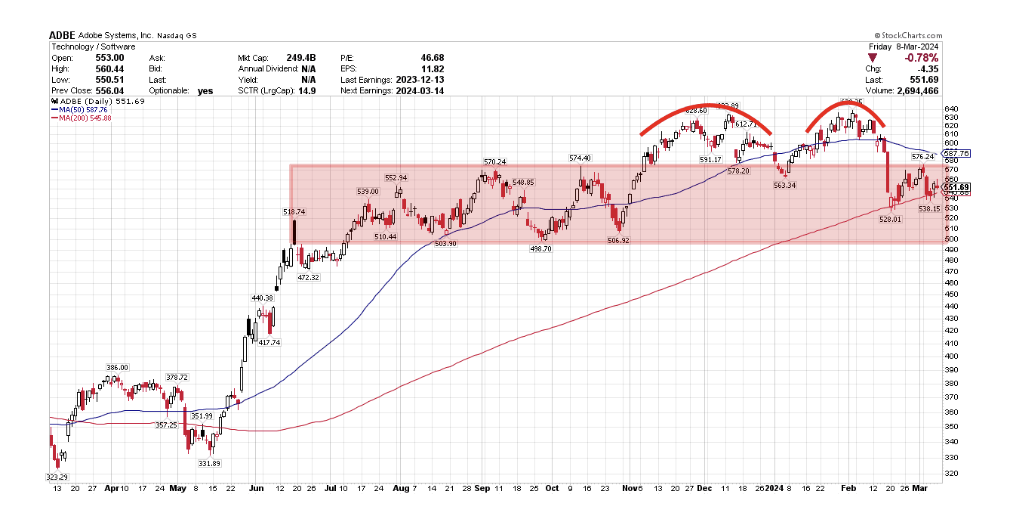
As seen in the chart above, the stock is back into its longer term trading channel after breaking out above it and reversing after forming a double top over the last four months.
Now it is testing its rising 200-day moving average and trying to hold on to a semblance of an uptrend. It is consolidating between that average and a declining 50-day moving average as we head into its numbers.
A break below and look for a decline to the $500 area as support, A positive reaction should see shares attempt to break back out of its longer term neutral zone and try to start a new leg higher. Watch the declining 50-day around $587 as another level of resistance.
Economic Calendar
Tuesday - CPI 8:30
Thursday - US Retail Sales, PPI, Jobless Claims 8:30
Friday - Empire State Manufacturing 8:30, Consumer Sentiment 10
THE WEEK THAT WAS
The week began with a couple of negative days, but that weakness was shrugged off by Thursday as all major indices rallied back to close at new all-time highs. However, momentum seemed to pause at the end of the week as a major reversal in some of the high flying tech stocks on Friday caused the markets to end marginally lower by week’s end.
The news that shaped the week came fast and furious. Events in Washington made headlines as the nation sat through the State of the Union address and the Fed Chairman’s testimony on Capitol Hill. Economic data was highlighted by Friday’s unemployment report and several prominent stocks also made news.
Powell Testimony. As expected, Jerome Powell did not make any major material shift in policy when testifying on Capitol Hill last week. He stuck to the narrative that the Fed will make their decisions one data point at a time when determining if and when to cut rates.
However, he did sound more dovish when he stated we are “close” to a rate cut. He didn't give specifics, but it was enough for Fed watchers to keep hope alive for a potential May cut.
The biggest news was the news that Fed officials would scale back plans to make banks hold more capital on their balance sheets. This comes on the heels of December testimony by executives from the U.S.’ largest banks claiming their banks were safe and any new restrictions on them would be detrimental to the American consumer.
Shares of Bank of America (BAC), Citigroup (C) and Wells Fargo (WFC) all gained over 3% on the week thanks to that news.
Unemployment Rate rose to 3.9% vs an expectation of 3.7%, yet U.S. job growth continued to top expectations as payrolls rose by 275,000 vs an expectation of 175,000 for the month of February. Wage growth remained flat despite the rise in jobs which was the perfect balance to not upset the macro picture.
The “soft landing” narrative remains intact despite what seemed like a hot number as jobs growth blew past expectations. Revisions lower to the prior two months that were overstated as well as wage gains diminishing keeps the potential rate cut narrative alive.
New York Community Bank (NYCB) shares collapsed 47% midweek on multiple stories that they were seeking outside capital to remain solvent. Add this news on top of a CEO change after last week’s announcement that they “identified material weakness in its internal controls” and investors panicked and ran for the exits.
However, after a halt to trading for news pending, shares rebounded completely when they announced they received a $1 billion cash infusion by former Treasury Secretary Steve Mnuchin’s Liberty Strategic Capital.
For now this stabilized shares and temporarily eased concerns from shareholders. Will this be enough to keep the bank solvent and lead to a rebound? Keep an eye on the bank’s deposits going forward. If its customers ran for the exits as quickly as shareholders have been these past few weeks, then there could be more trouble on the horizon.
For the week shares of NYCB lost -3.7% to close at $3.42 which was well off its weekly low of $1.70.
Heat Map. With the exception of Nvidia, all the megacaps ended the week in the red. In fact, NVDA was down -5.5% on Friday, but still managed another solid week of gains.
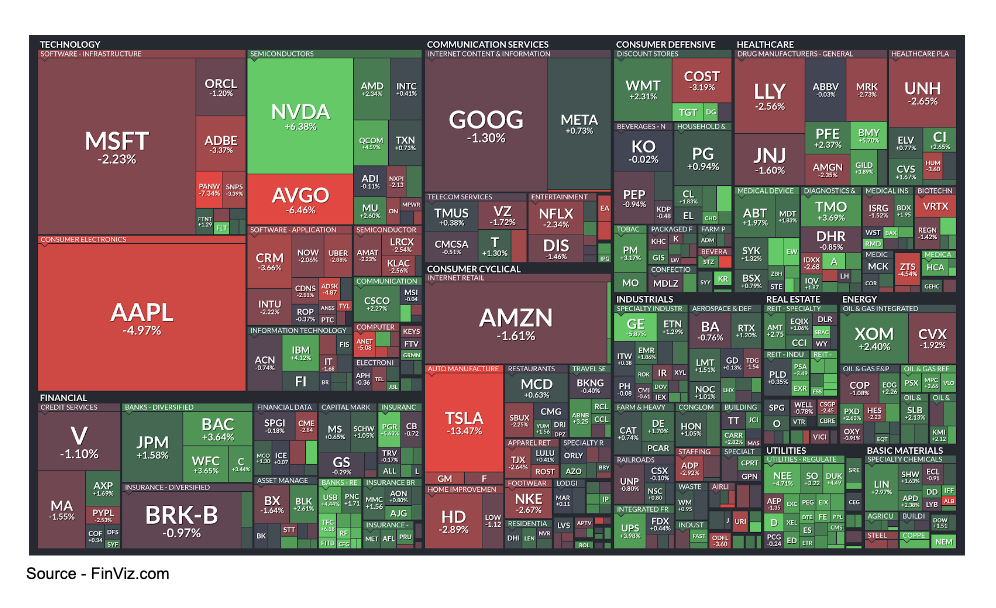
The winners were the large cap banks, utilities, industrials, real estate, and basic materials. Not necessarily headline grabbing names, but plenty to help the bullish narrative continue.
STOCKS IN THE NEWS
Novo Nordisk (NVO) the weight loss drug maker known for its diabetes drug Ozempic and weight loss drug Wegovy surged to a new record high after presenting results from a new weight loss treatment. Amycretin helped patients lose 13% of their weight in 12 weeks.
This drug comes in pill form unlike its other two blockbusters that are injectables. While it is still in its early stage trials, investors pushed shares higher by 7.1% this week to close at $133.07.
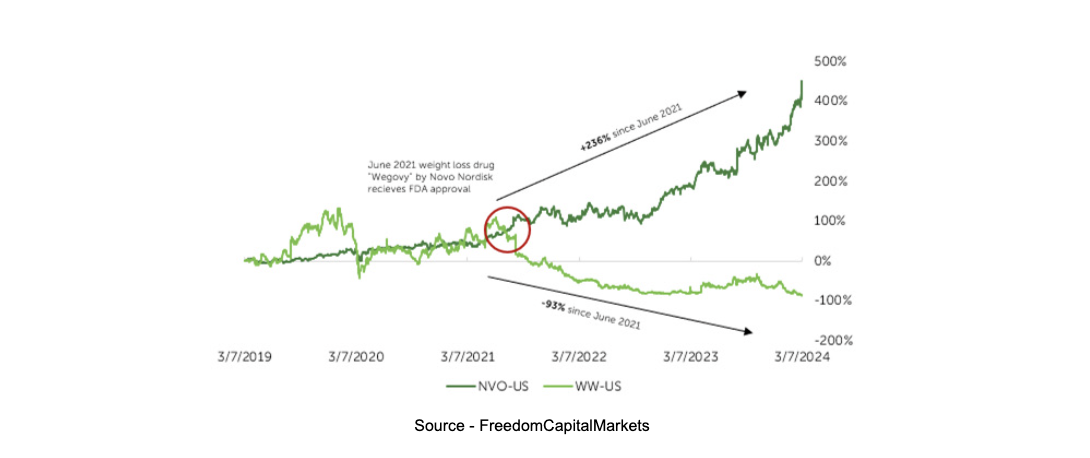
On the other hand, shares of the most well known weight loss company in Weight Watchers (WW) continue to shed market cap as a result of the progress made by NVO. Their shares fell another -11.2% last week and are now lower by -45% over the last 52-weeks.
Since June 2021, when NVO received FDA approval for WeGovy, shares have gone in opposite directions. NVO has fattened investors pockets with a gain of 236% since that announcement, while WW saw its share value slim a whopping -93% from its peak.
Victoria’s Secret (VSCO) suffered its worst day ever after reporting results that were mixed and guidance that disappointed the street. They expected further declines in revenue in both the next quarter and the entire year. As a result, shares dropped -36.3% to close at $18.12.
Tesla (TSLA) and Apple (AAPL) - Magnificent no more?
TSLA had a rough week after a suspicious fire at its largest plant in Germany halted production. Not only that, deliveries in China continue to trend lower amid pricing wars.
Prior to this week, the rollout of the much anticipated Cybertruck missed on several metrics. The battery life was less than anticipated and the starting price point was higher than expectations.
According to Bloomberg data, buy ratings on TSLA are the lowest in three years. They have missed the mark on earnings over three of the last four quarters and fallen an average 9.75% after the last four reports.
Apple (AAPL) also has its own issues with China. iPhone sales are down 24% in the land of the rising sun. This was more than anticipated and alarming in that 17% of Apple’s revenue is generated by China sales.
AAPL has also lacked that next big thing. The VR headsets were seen as too big and too expensive. While well liked, they have yet to become the next game changer for them. Then there is the venture into AI. Investors are still waiting for them to make that big leap, but have yet to see anything promising at this time.
As a result, money has moved out of both names and into other aspects of the market. The biggest winners continue to be the semiconductor names as well as cybersecurity stocks.
Last week both stocks were hit again. Shares of TSLA dropped -13.5% to close at $175.34. It is trading at its lowest levels since May 2023 and is lower by -29.4% this year. AAPL fell another -5% and is down -11.3% for the year. It is trading at its lowest levels since October, 2023.
MARKET STATS
Despite hitting new highs on Thursday, the momentum slowed a bit on Friday. A reversal in many big tech names caused a sell-off that caused the major indices to finish the week lower. The only one to manage to lift was the Russell 2000. The small cap index squeaked out a minor gain and is now the best performer for March.
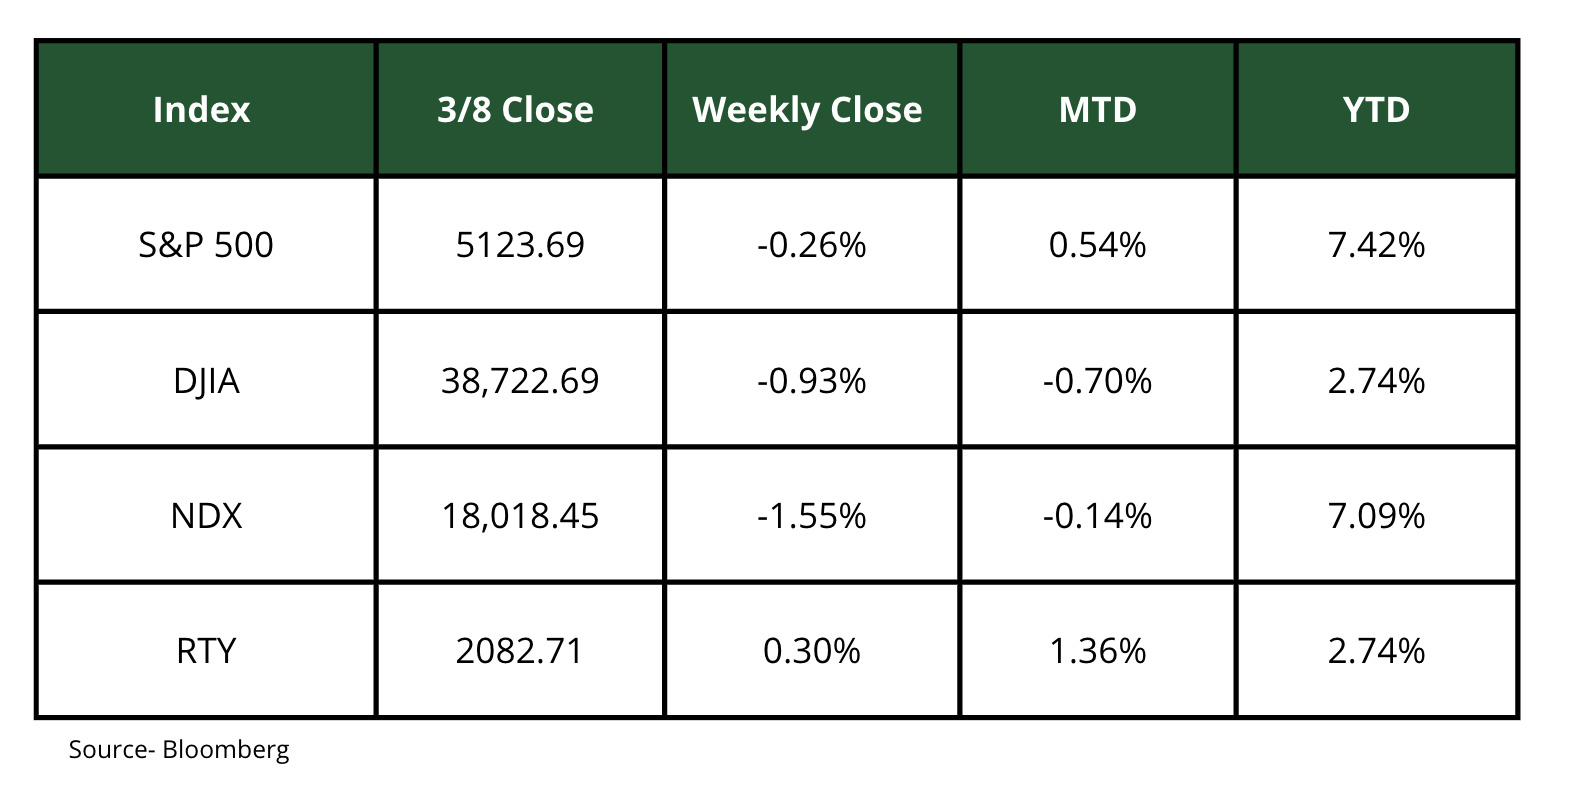
The Nasdaq 100 and S&P 500 were affected by a sharp reversal in shares of Nvidia on Friday. The semiconductor giant saw shares explode higher at the open to peak at $974 only to reverse dramatically and close nearly $100 lower at $875.28. Despite the major reversal, shares still finished the week higher by 6.4%.
Fun Fact - If we were to conduct a March Madness seeding amongst stocks based on their percentage impact on the S&P 500 year-to-date, you’d be shocked to see the current bracket.
The top four seeds based on percentage gains so far would be Nvidia, Meta, Microsoft and Amazon. These four stocks account for 57.9% of the gain in the index.
On the flip side, you’d be shocked to see the four lowest seeds that they would square off against in round one. The lowest seeds, aka the worst performers, are currently Apple, Tesla, United Healthcare and Boeing. They account for -20.1% of the losses in the index.
SECTOR WATCH
The stocks that regularly led this market higher took a back seat to more defensive names like Utilities (XLU) and Real Estate (XLRE). Materials (XLB) also remained strong with a gain of 1.6%. Materials are the best performing sector over the last month with a gain of just under 8%.
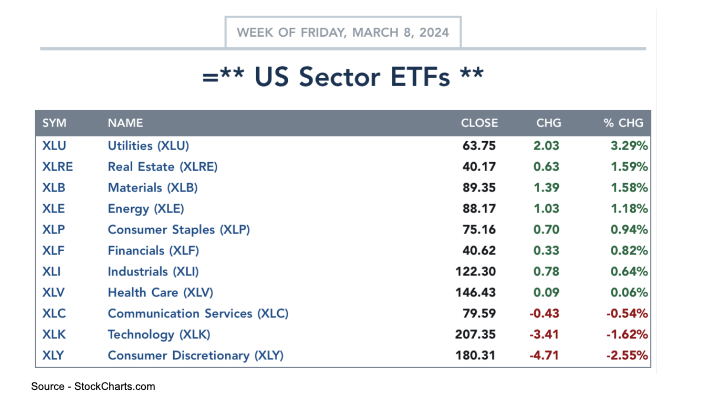
Consumer Discretionary (XLY), Technology (XLK) and Communications (XLC) lagged again as the rotational trade continued. They were the only sectors to finish the week lower.
Shared content and posted charts are intended to be used for informational and educational purposes only. CMT Association does not offer, and this information shall not be understood or construed as, financial advice or investment recommendations. The information provided is not a substitute for advice from an investment professional. CMT Association does not accept liability for any financial loss or damage our audience may incur.
