YOUR WEEKLY ROADMAP
We are heading into a holiday shortened four-day week to end the month of March. Yet, it's the Good Friday holiday when we get the biggest economic data point of the month in the PCE - otherwise known as the Fed’s preferred inflation data point.
With the lack of big news and a paucity of earnings, it should be a slow week. Let’s look a little closer at the bull run and the Fed’s ongoing narrative.
So much for a pullback. The market keeps chugging along. I was concerned we didn’t have a new catalyst to take the market higher. What I should’ve focused on was what could derail this bull run. Currently there isn’t much as the trend remains strong and steady coming down the homestretch of the first quarter.
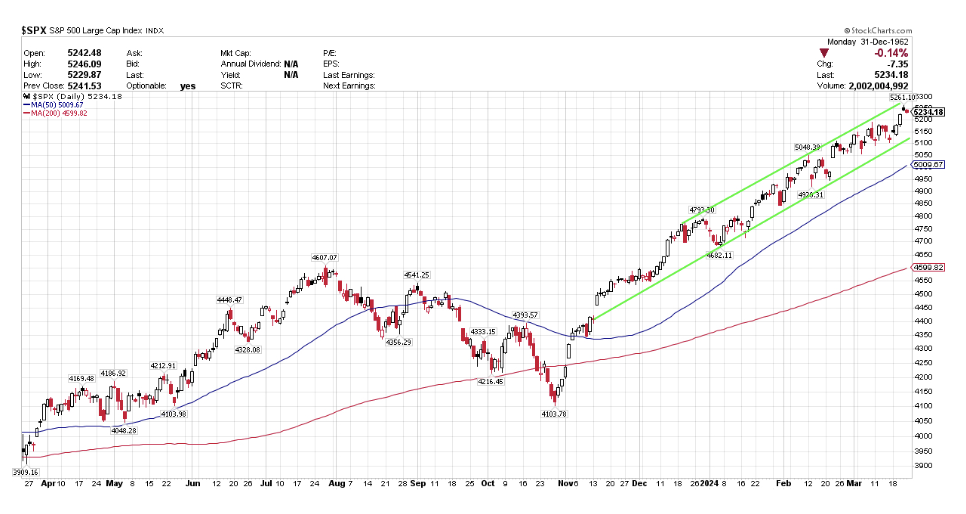
As for the Fed, we consistently get the same narrative but it keeps working. Which seems to mean that boring and predictable commentary from Jerome Powell will remain music to the market's ears and keep this rally alive.
Fed Doing the Macarena. Regardless of hearing the same tune meeting after meeting, the bulls are loving it. It reminds me of 1996 - not in market terms, but in music terms. Did you know that The Macarena by Los del Rio was the number one song on the Billboard Hot 100 for FOURTEEN weeks? It’s head scratching to think this was true, but sadly it was.
In the case of Jerome Powell, his favorite tune is “one data point at a time”. It is the same song we hear meeting after meeting, yet it keeps the market at all-time highs (20 of them so far in 2024) and it is starting to get a tad frustrating hearing it over and over again. But heck, if it works, like the Macarena, play it into the ground until it doesn’t.
Personal Consumption Expenditures (PCE) known as the Fed’s preferred inflation measurement - is expected to remain stable at 2.8% year-over-year when released on Thursday.
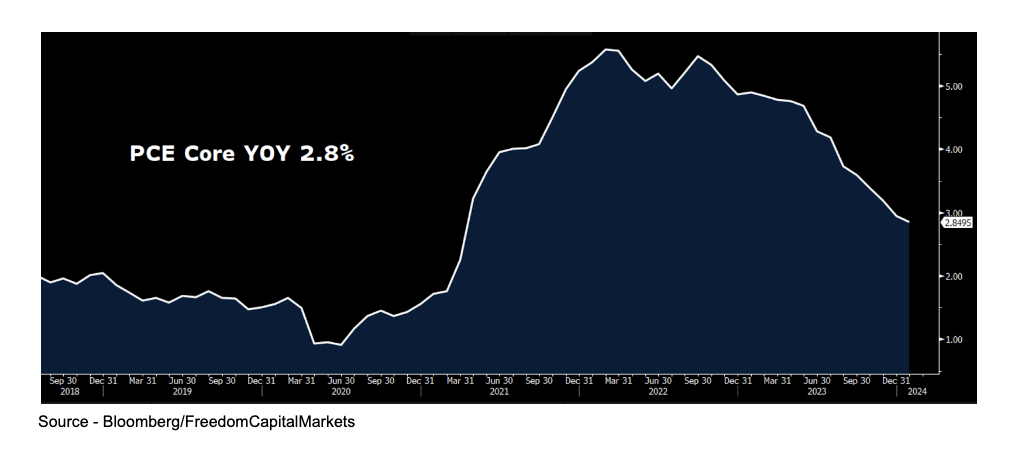
The Fed prefers this inflationary measure more than the CPI because it covers a broader range of spending. Unlike the CPI and PPI numbers, we haven’t had many upside surprises in the PCE as it continues to slowly trend lower. Given that this is released on the Good Friday holiday, the market won’t be able to react to this number until April.
A PCE number in line with expectations will help bolster Jerome Powell’s talk that we are “close” to a rate cut. Let’s look at the latest probability chart from the CME Group.
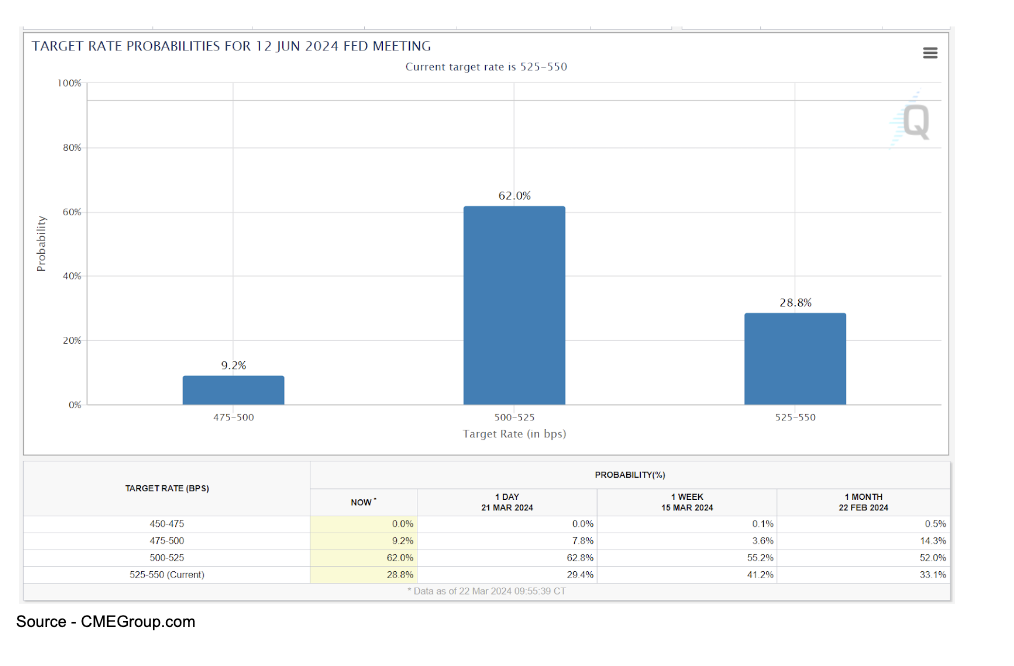
The chances of a cut at the next meeting in May remain slim at 14%. It is the June meeting that saw the odds of a cut increase from 59% a week ago to the current level of 73% since the Fed meeting.
Sector to Watch - Energy.
The energy sector has been on a tear over the last few weeks as oil prices hold above $80. Shares of the Energy Select Sector (XLE) are on the verge of a major breakout and are doing it without its biggest components in ExxonMobil (XOM) and Chevron (CVX). Those two stocks alone make up 40% of the XLE.
If you are following the XLE you better know what these two stocks are doing. The two oil giants are just starting to move. XOM is up seven straight weeks and 20% over that time, yet it remains 6% below its 52-week highs.
CVX hasn’t done as well, but has rallied 12% since January. It is still 11% below its 52-week highs. If they can make runs to 52-week highs then watch for them to lead the breakout in the sector.
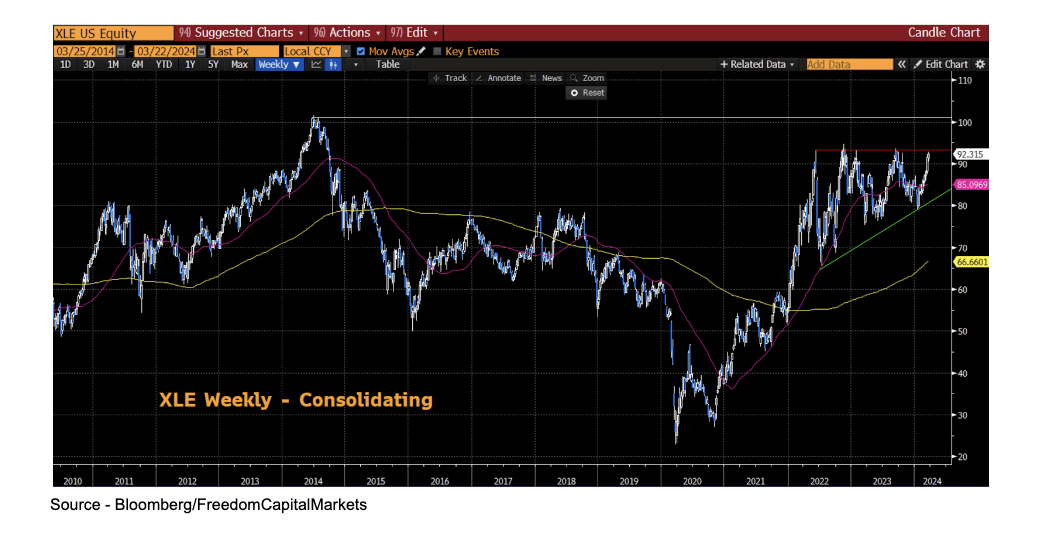
Technically, let's look at the weekly chart of the XLE. The sector has been consolidating over the last two years. It has formed a bullish ascending triangle pattern in which it is consistently making higher lows, but hasn’t broken above its major resistance at the $92.50 area.
Over the near term it is just starting to break out. Given this setup, look for more momentum to move into the sector as it could easily make a run to its 2014 all-time highs at the $102 level.
Earnings. This is the slowest week of earnings I can recall in some time. When we focus on stocks like Carnival Cruise and Walgreens you know it's slim pickings.
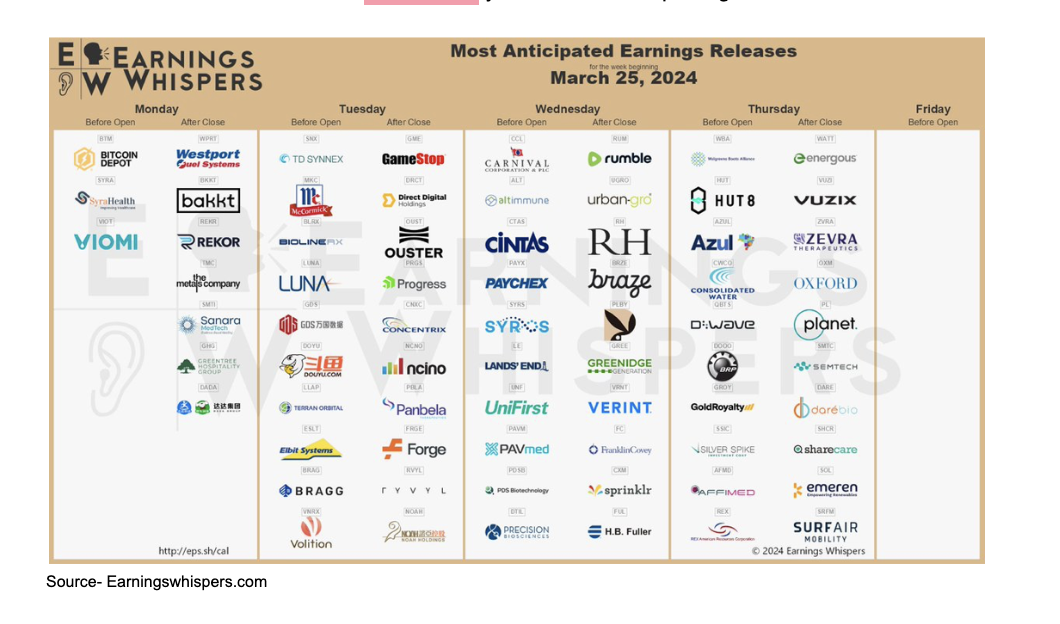
Stocks in Focus…
Carnival Cruise Lines (CCL) shares are lower this year by -7.9%, but are still up by 90% over the last 52-weeks. However, it still has a long way to go to return to its pre-pandemic levels. In fact, shares are 72% below their 5-year highs.
So how are they doing compared to their competitors in the cruise line space? CCL is trending more with Norwegian (NCLH) than peer Royal Caribbean (RCL). While the cruise lines have started to reverse course, RCL (as seen below) has left its peers in the dust.
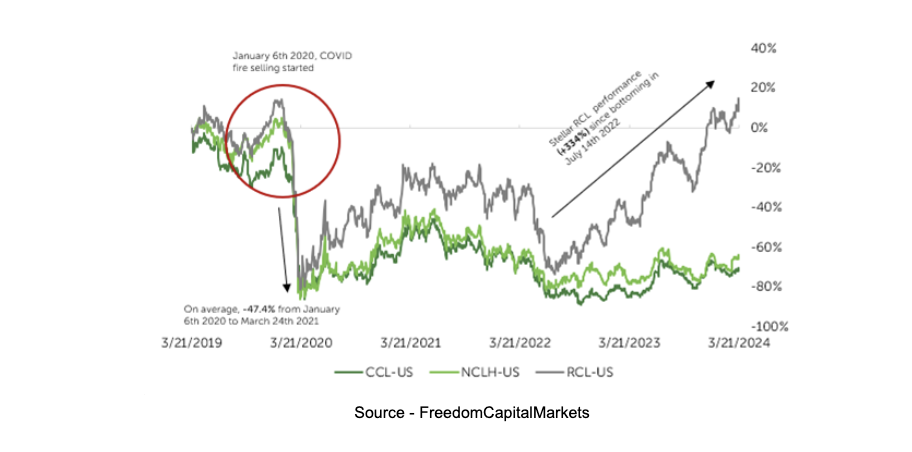
Royal Caribbean is roughly flat for the year but up an astounding 124% over the last 52-weeks and the only one in the group to turn a profit. Norwegian Cruise is up 3.3% YTD, and up 66% last 52-weeks.
As for CCL earnings, they report Wednesday and look to beat their EPS projections for the sixth consecutive quarter. Analysts are looking for losses again this quarter with estimates at -0.17 a share. Expect a bumpy ride as implied volatility on earnings day is +/- 9.3%.
Technically a gap to and above the $20 level would be a nice breakout and could lead to smoother sailing over the coming months.
Walgreens Boots Alliance (WBA) The former Dow stock continues to slowly trend lower trading at its lowest levels since 1998. Will this be the quarter that things finally turn around for the retail drugstore chain?
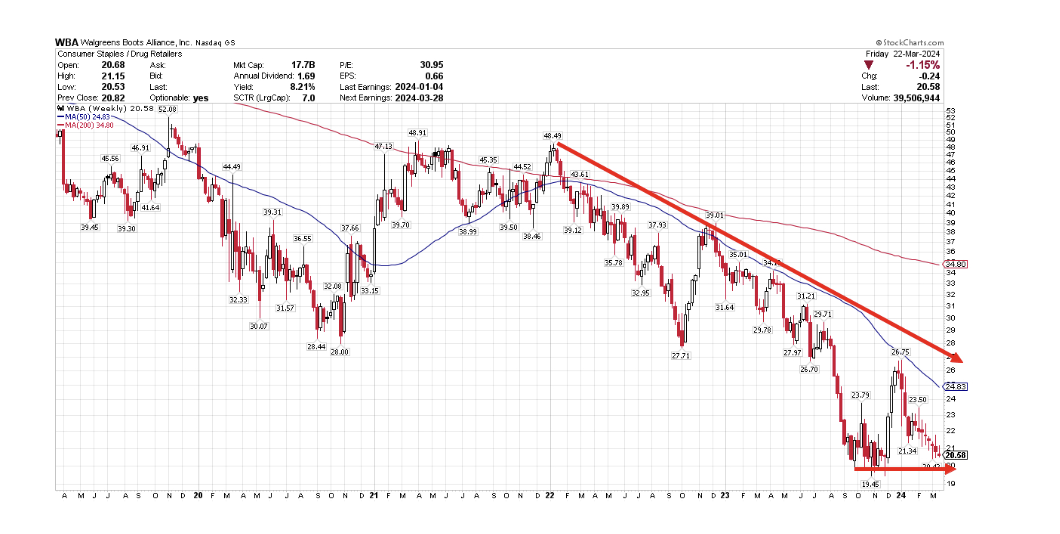
Shares have traded lower after six of the last nine quarters. Each time the stock has rallied it has been met with strong selling. Watch the $20 area closely. This has continued to act as a strong support area for the stock. Can it withstand another wave of selling and hold support? Will a rally be sustainable or will it fail again at its downtrend and declining 50-day moving average?
Economic Calendar. The market will be closed for Good Friday, but key economic data will still be released.
Economic Calendar
Monday - New Home Sales 10:00
Thursday - Initial Jobless Claims, GDP 8:30; Pending Home Sales, Consumer Sentiment 10:00
Friday - Market Closed - Good Friday; PCE 8:30
THE WEEK THAT WAS
The indexes had their best week of the year as the S&P 500, Nasdaq 100 and the Dow Jones Industrial Averages all traded at record highs this week.
Last week we mentioned watching the 10-year yield and the 4.35% level. The 10-year got to that mark on Monday and failed to break above it. The failure of the 10-year to breakout combined with more dovish Fed speak after the FOMC held rates steady for the fifth consecutive meeting helped the bull run continue. As yields decreased, the markets jumped higher.
FOMC Meeting. As mentioned earlier, Jerome Powell kept his narrative the same. In fact, his statement was almost a carbon copy from the meeting before. He did change targets for GDP growth from 1.4% to 2.6%, unemployment target to 4% and the core PCE target was adjusted slightly higher from 2.4% to 2.6%. None of these changes were seen as dramatic or worthy of a change in the Fed’s direction.
The real story was the “getting close” to rate cuts comments as Powell downplayed recent inflation data in the CPI and PPI that appeared sticky.
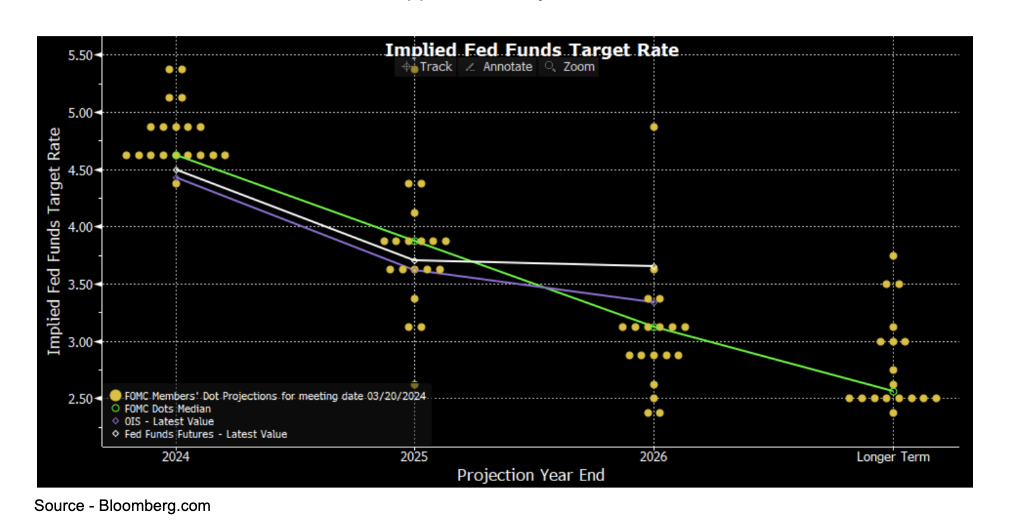
The other item of interest was the quarterly release of the Dot Plot. The notable change was that three Fed officials that were below the consensus of three cuts, changed their year end target to jive with the majority that believe the Fed will cut three times.
Apple (AAPL) had a roller coaster week. They began last week with an announcement that they were partnering with Alphabet (GOOGL) to offer their Gemini AI on future iPhones. This caused shares of both companies to rally.
However the good feelings in Cupertino didn’t last long. Later in the week, the Department of Justice announced an antitrust lawsuit against the company. Lawsuits like this have been commonplace against many of the technology giants like Microsoft and Alphabet, so don’t expect any resolution soon.
Shares of AAPL dropped as much as 5% on that news, but finished the week relatively flat losing only -0.2%. For the year, the second biggest stock in the S&P 500 is down -10.4%, but hasn’t dragged down the overall market.
STOCKS IN THE NEWS
Chipotle (CMG) announced a 50-for-1 stock split effective in June. The news sent shares higher by 4.6% last week as they closed at $2,882.04.
Retail reeling… Last week’s earnings reports in the athleisure wear and sports retail giants saw an outperformance compared to analyst expectations. However, shares of both Nike (NKE) and Lululemon (LULU) retreated after issuing weak guidance that overshadowed the positive results.

Shares of NKE dropped by over 8% after giving a softer than expected outlook and saw a continued sales slump in China. They closed at $93.86, its lowest level since last September. The gap lower in shares may not bode well over the coming months as I discussed here (2:28 mark) on CNBC last week.
LULU shares lost over 16%, its biggest single day drop since March 2020, after warning of slowing visits to North American stores. These new trends weighed heavily with investors as the stock dropped to $403.19. The stock gapped below its key 200-day moving average and closed at its lowest levels since October of last year.
Micron (MU) was one of the biggest winners of the week after reporting earnings that crushed analyst expectations. The chip maker had its biggest gain since 2014 and traded to new all-time highs. Shares finished higher by 18.2% to close at $110.21.
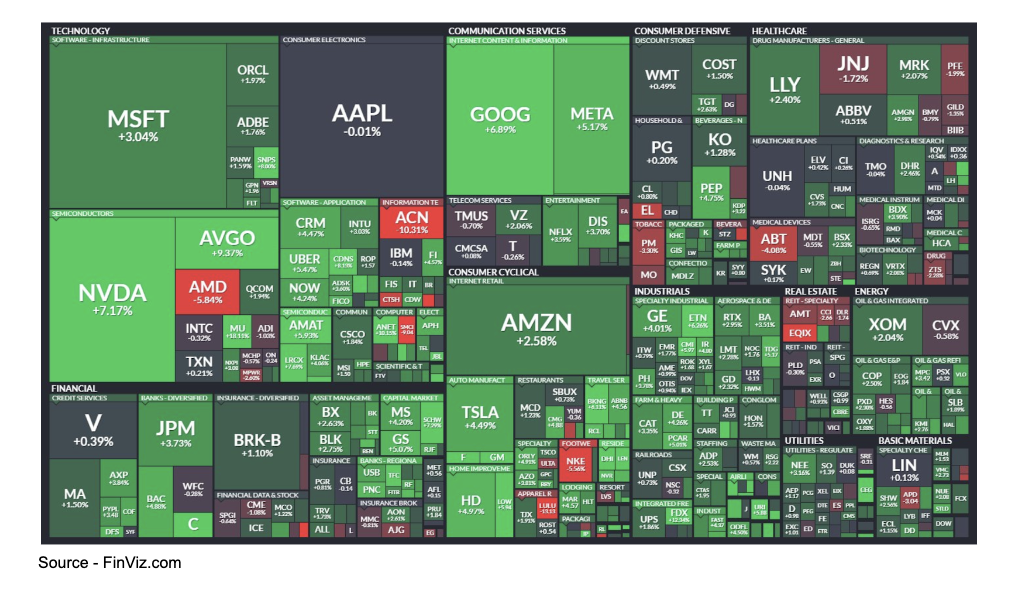
Heat Map. The St. Patrick’s Day green theme continues as the megacaps dominated the weekly map. However, strong weeks from Industrials, Energy and Consumer Staples also contributed to the rally as the major indexes finished at new weekly highs.
IPO ACTIVITY
It’s been a while since we have been able to feature this section and its nice to see it return to the weekly market letter. This week we saw two high profile companies go public in Astera Labs (ALAB) and Reddit (RDDT).
Astera Labs, according to Bloomberg “develops and deploys semiconductor based connectivity platforms built for cloud and AI infrastructure”. In layman’s terms, its the first AI related company to go public
Shares priced above the expected range at $36, opened at $52.56, peaked at $80 and finished the week at $70.

Reddit, the online discussion platform, priced at $34 a share which was the high end of its expected range. Retail investors' appetite to gobble up shares was evident given the volume on day one more than doubled the amount of shares floated.
Shares opened at $47, peaked at $57.80 and closed the week at $46. That was good for a 33% gain.
Given the success of these rather two high profile names and the market trading at all-time highs, expect a wave of new issues to rush to market. In fact, two new issues announced plans on Friday afternoon.
The SPAC Digital World Acquisition (DWAC) approved a merger with former President Donald Trump’s social media company. Shares of the newly merged company may trade as early as this week under the symbol DJT.
Also Friday, a Walmart backed digital marketing company named Ibotta announced plans to list at the NYSE under the ticker IBTA.
MARKET STATS
After two consecutive weekly declines in the major averages, the markets roared back to new highs as we wind down the first quarter. The Dow Jones Industrial Average flirted with the 40,000 mark briefly before retreating Friday to close at 39,475. The index still managed to have its best week of 2024 despite the pullback Friday.
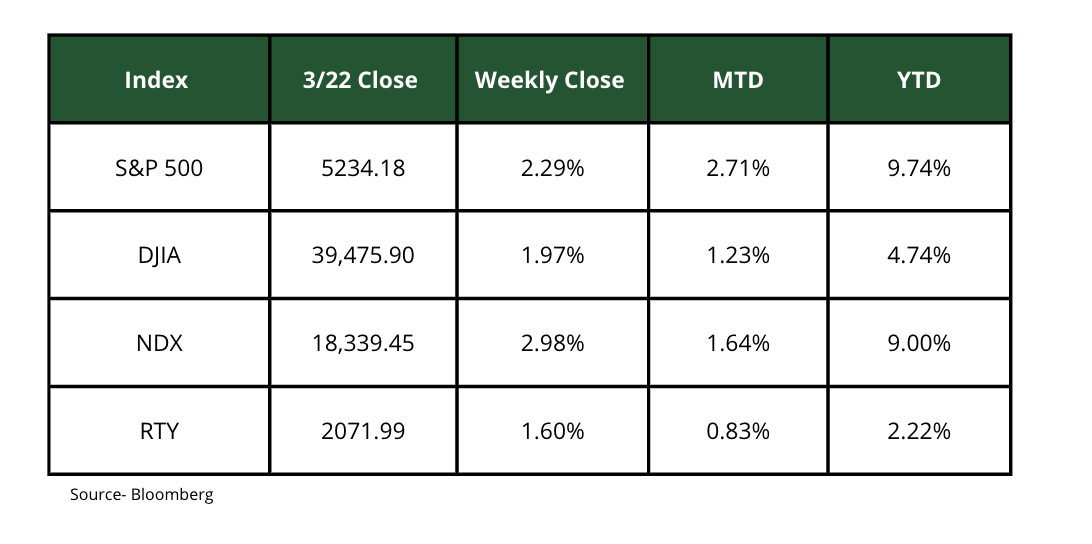
The S&P 500 continues to be the top performing index year-to-date as it is now up close to 10%. Nipping at its heels is the Nasdaq 100 which is up exactly 9%. The Russell 2000 continues to lag but saw a nice bounce back after recent weakness and continues to stay above that psychologically important 2000 mark.
Fun Fact - We haven’t talked too much about Nvidia (NVDA) this week… until now.
Did you know that shares of NVDA are riding an 11-week winning streak? They have yet to close lower for a week this year.
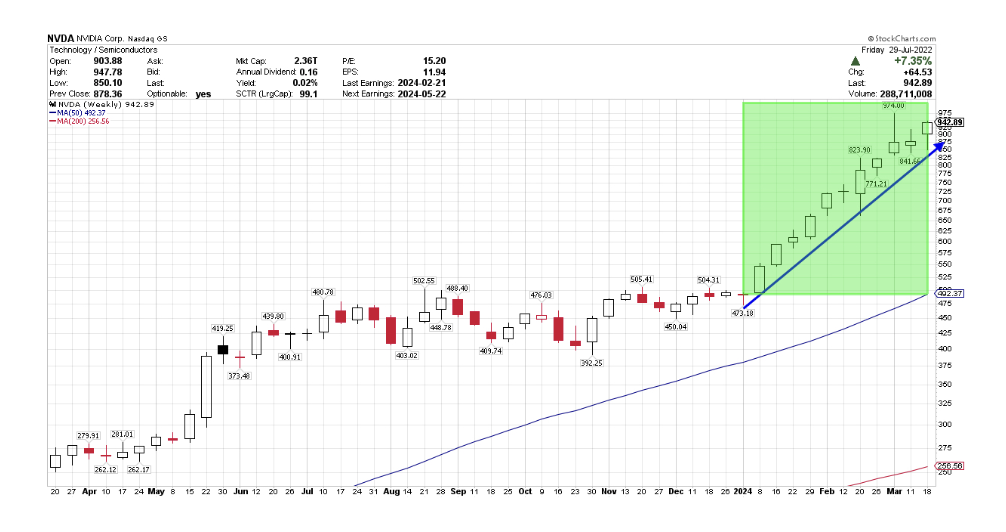
It has never had a weekly winning streak this long in its history. During this streak shares are up a whopping 90%. Not a bad start to the year.
SECTOR WATCH
Another solid week across the board as ten of the 11 primary sectors finished the week higher. Leading the charge were Communications (XLC) thanks to strong week’s its top components in Alphabet and Meta. It is now the leading sector for 2024 - up 12.9%.
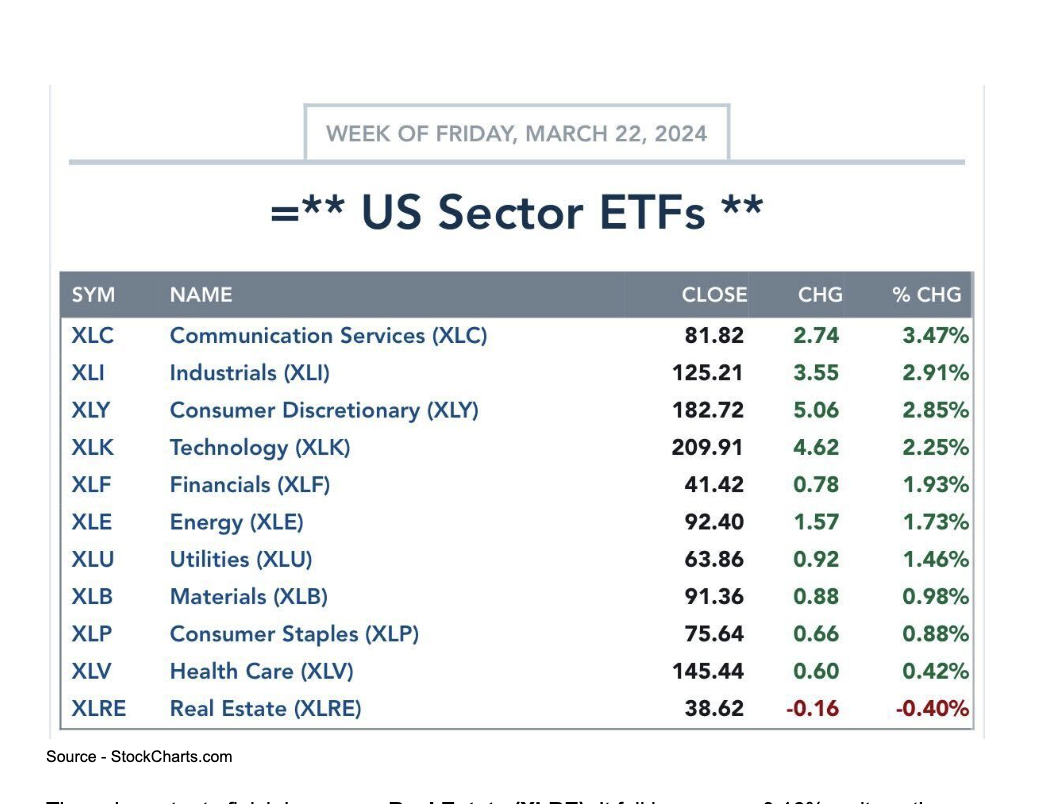
The only sector to finish lower was Real Estate (XLRE). It fell by a mere -0.16% as it continues to be the worst performing sector and the only sector don for 2024. The XLRE is lower by -2.94% year-to-date.
Shared content and posted charts are intended to be used for informational and educational purposes only. CMT Association does not offer, and this information shall not be understood or construed as, financial advice or investment recommendations. The information provided is not a substitute for advice from an investment professional. CMT Association does not accept liability for any financial loss or damage our audience may incur.
