| Investopedia is partnering with CMT Association on this newsletter. The contents of this newsletter are for informational and educational purposes only, however, and do not constitute investing advice. The guest authors, which may sell research to investors, and may trade or hold positions in securities mentioned herein do not represent the views of CMT Association or Investopedia. Please consult a financial advisor for investment recommendations and services. |
Building Permits
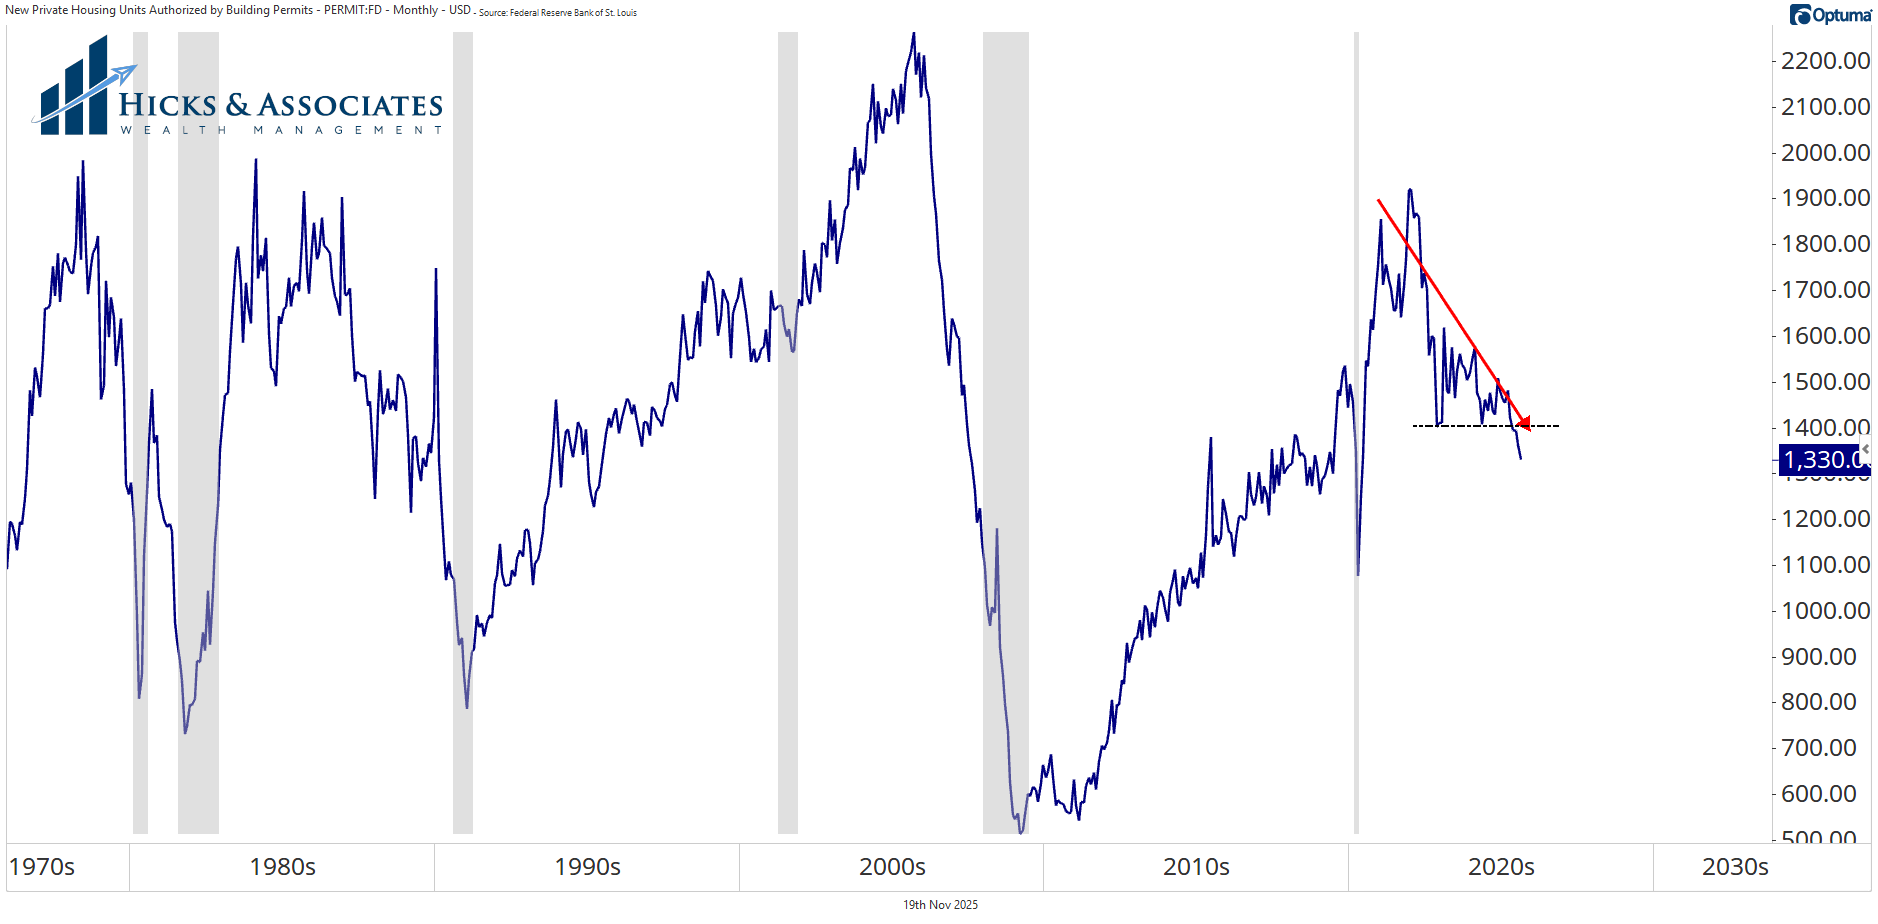
There are so many ugly equity charts, I’m going to show a few economic charts. The first one is one of my biggest concerns, from an economic perspective. This first chart is Building Permits. Housing and building is such an important component of the economy, when we see such a strong negative trend, it’s not a good sign.
The black line on the chart, that’s where I was hoping building permits would find support. But it has fallen through that level in fairly dramatic fashion. If the Fed lowers rates next month – IF – then I would hope this trend changes shortly thereafter. But for now, this is a macro-economic concern.
Schannep Recession Indicator
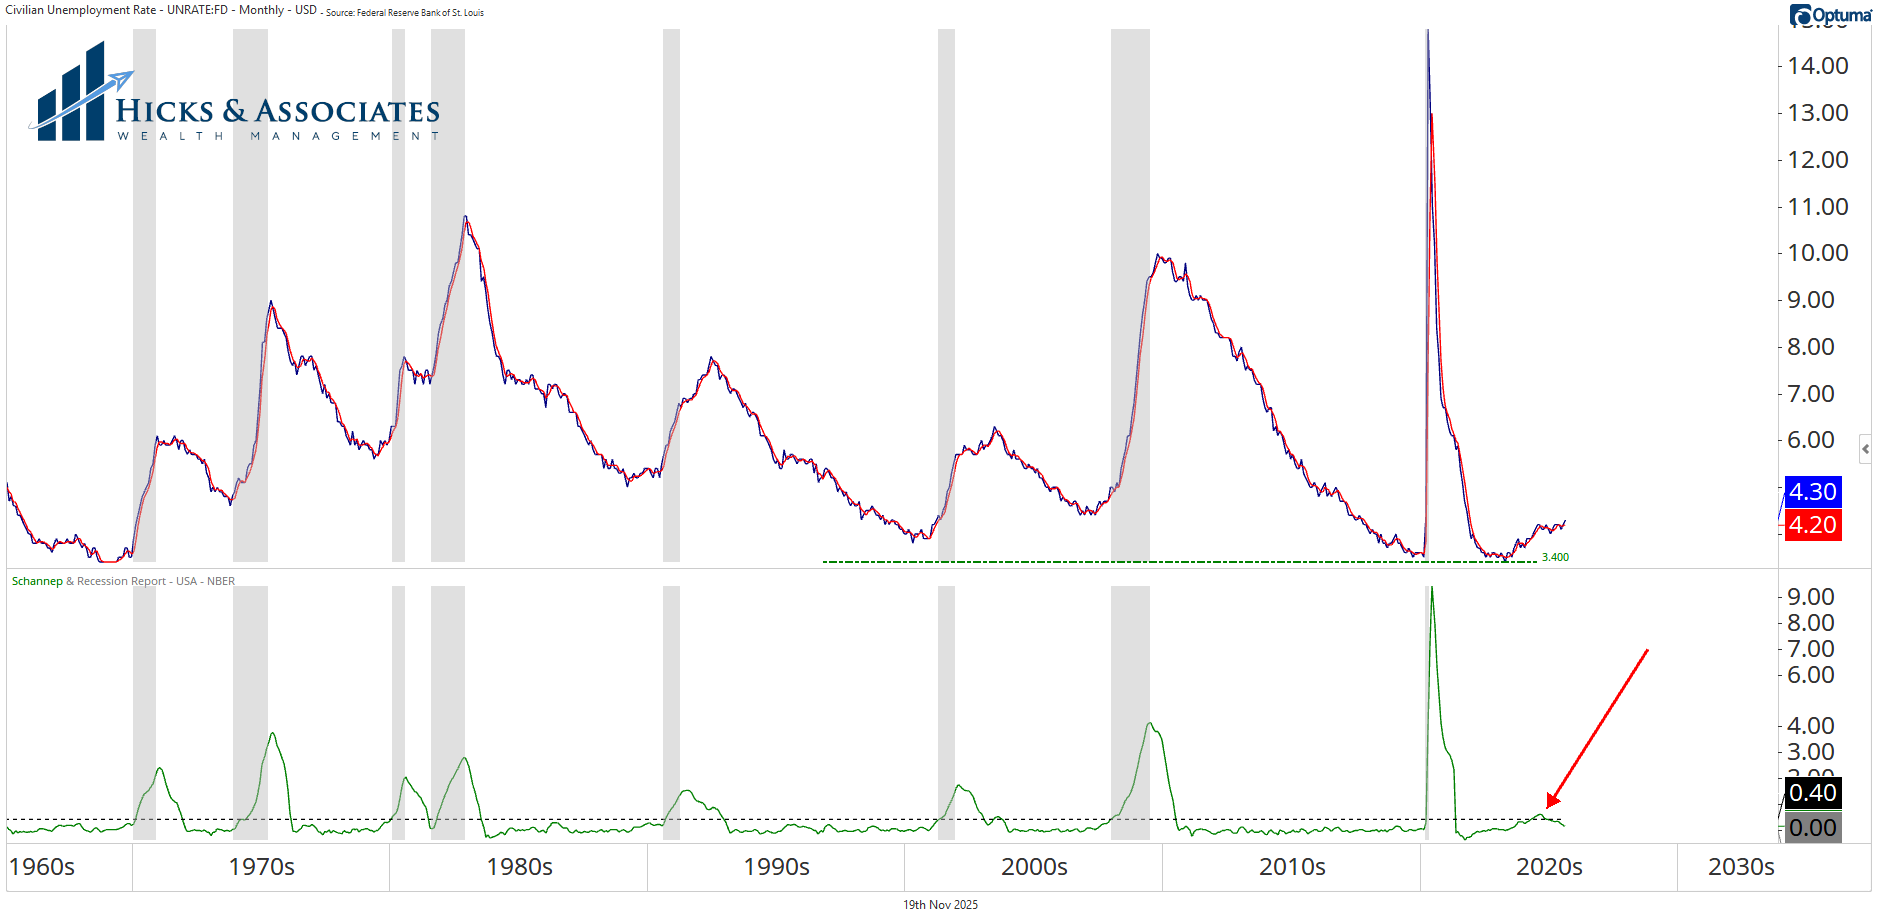
One of the things I love about the technical community is how open most of us are to sharing. A year or two ago, a fellow CMT Charterholder shared this indicator with me. I had never heard of the Schannep Recession Indicator. But, take a look at that chart and you’ll see it’s pretty accurate.
In the top pane, we have the unemployment rate. The bottom pane is the Schannep Recession Indicator. I honestly do not know how it is calculated, but I shared the calculation with my friends at Optuma and they programed the chart for me. Team work!
Bottom line, when the indicator (green line in the bottom pane) rises above the 0.40 level, a recession is (historically) at hand. Scan that chart and you’ll see it’s pretty accurate. Now notice the red arrow. In May of 2024, the indicator flashed the recession sign. It has since fallen back below. Perhaps we’re in the clear now, but perhaps this helps to explain the underlying weakness of so many stocks?

Chicago Fed – Financial Conditions
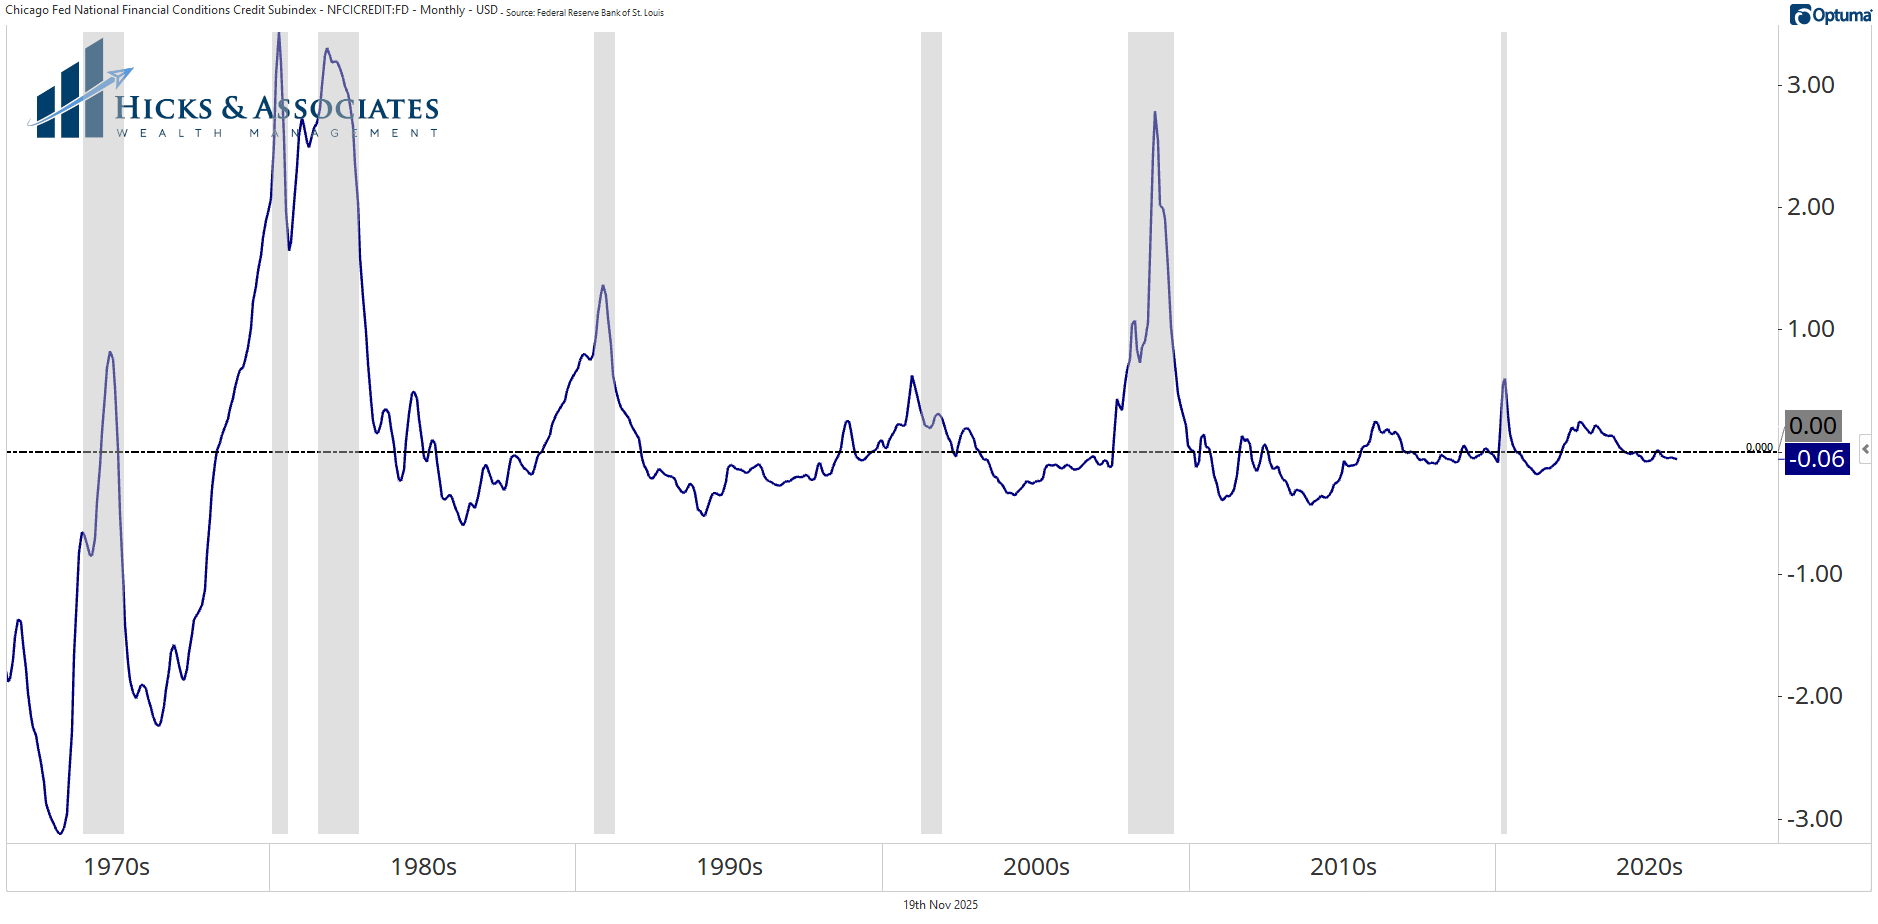
This next chart comes from the Chicago Federal Reserve. This is the Financial Conditions Credit Subindex. This index usually rises as a recession approaches. This chart is also not flashing recession warning signs as it is below the zero line.
COPX
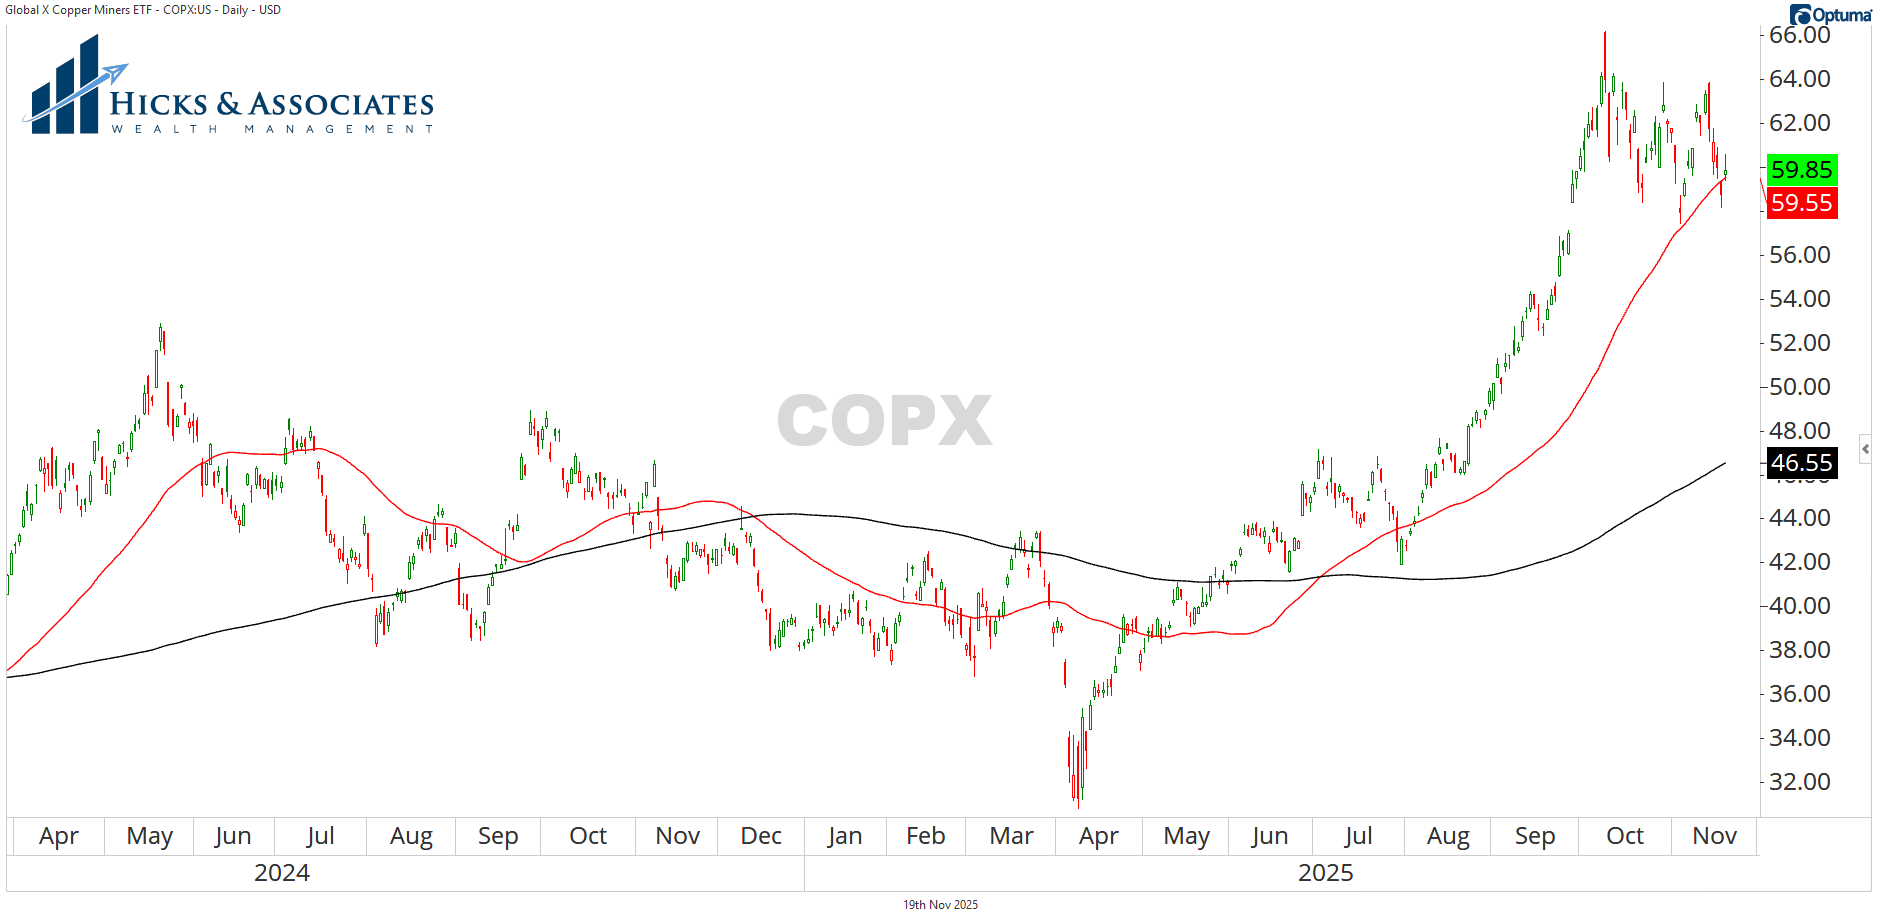
Watching the price of copper is another habit of mine as I assess the economy. Unfortunately, something goofy happened to my chart so I’m a little blind on that one at the moment. But…
Let’s take a look at COPX, the Global X Copper Miners ETF.
While this minor pullback might be over, just in case it’s not, I want to look for other opportunities as we are unconstrained. By that I mean, if we want to be heavily invested in one sector, our Investment Policy Statement allows us that latitude. Therefore, if most of the equities are in the tank, I want to look for something that is in a positive trend. At the moment, COPX looks worthy of watching. We would not buy it here, but it looks like it is building out a base that could create a nice buyable pivot.


Theodore Hicks II, CFP, CKA, CMT is the Founder, CEO & Chief Investment Officer of Hicks & Associates Wealth Management, an SEC registered investment advisor. Hicks’ rules-based asset management approach is focused on minimizing drawdowns while seeking to maximize gains. You can follow him on Twitter or LinkedIn.

Shared content and posted charts are intended to be used for informational and educational purposes only. CMT Association does not offer, and this information shall not be understood or construed as, financial advice or investment recommendations. The information provided is not a substitute for advice from an investment professional. CMT Association does not accept liability for any financial loss or damage our audience may incur.
