Investopedia is partnering with CMT Association on this newsletter. The contents of this newsletter are for informational and educational purposes only, however, and do not constitute investing advice. The guest authors, which may sell research to investors, and may trade or hold positions in securities mentioned herein do not represent the views of CMT Association or Investopedia. Please consult a financial advisor for investment recommendations and services
Defense Over Offense Suggests Further Rotation
By tracking a ratio of the Consumer Discretionary to Consumer Staples sectors, we can gauge whether investors are leaning into “things you want” over “things you need.” Consumers will tend to spend on discretionary purchases during bullish environments, yet they will often hold off when economic conditions are less favorable. But since consumers tend to always spend money on “necessities” like cleaning products, personal care goods, and beverages, the Consumer Staples sector is more immune to economic shifts.
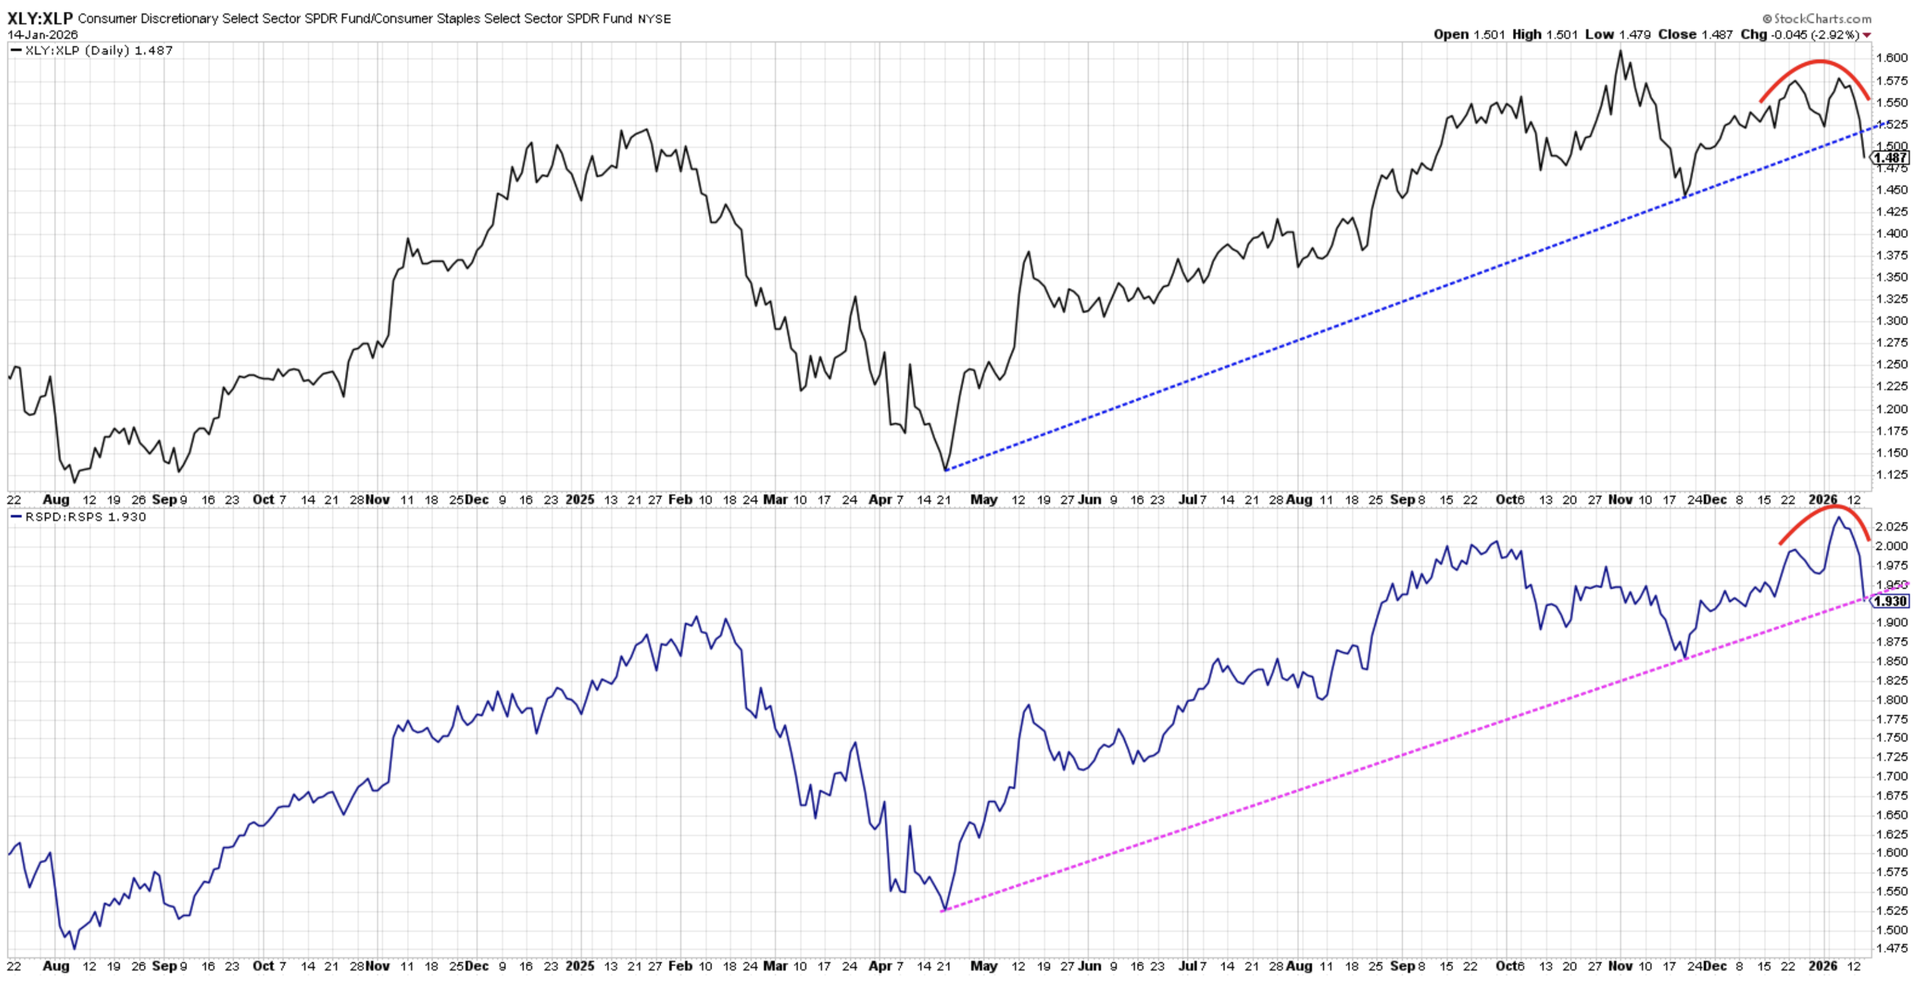
The top panel shows this “offense to defense” ratio using the traditional market cap-weighted ETFs, while the bottom panel features the equal-weighted ETFs for the two consumer sectors. While both ratios trended higher off the April 2025 market low, and the cap-weighted ratio continued higher into a late October peak, the equal-weighted version topped out in late September.
Both ratios have turned lower this week, signalling a failed breakout above their 2025 tops. This recent pullback has now brought the long-term uptrend thesis into question, as both ratios are struggling to hold trendline support based on the April and November lows. If these ratios continue lower into late January, that could indicate a defensive rotation and suggest caution for investors going into February.
Microsoft Breaks Below Key Fibonacci Support
Even though a number of technology stocks remain near all-time highs, we’ve observed a continued rotation from growth into value. We’ve even noted dispersion within the Magnificent 7 stocks, with the strength in charts like Alphabet (GOOGL) providing an excellent counterpoint to the weakness in names like Microsoft (MSFT).
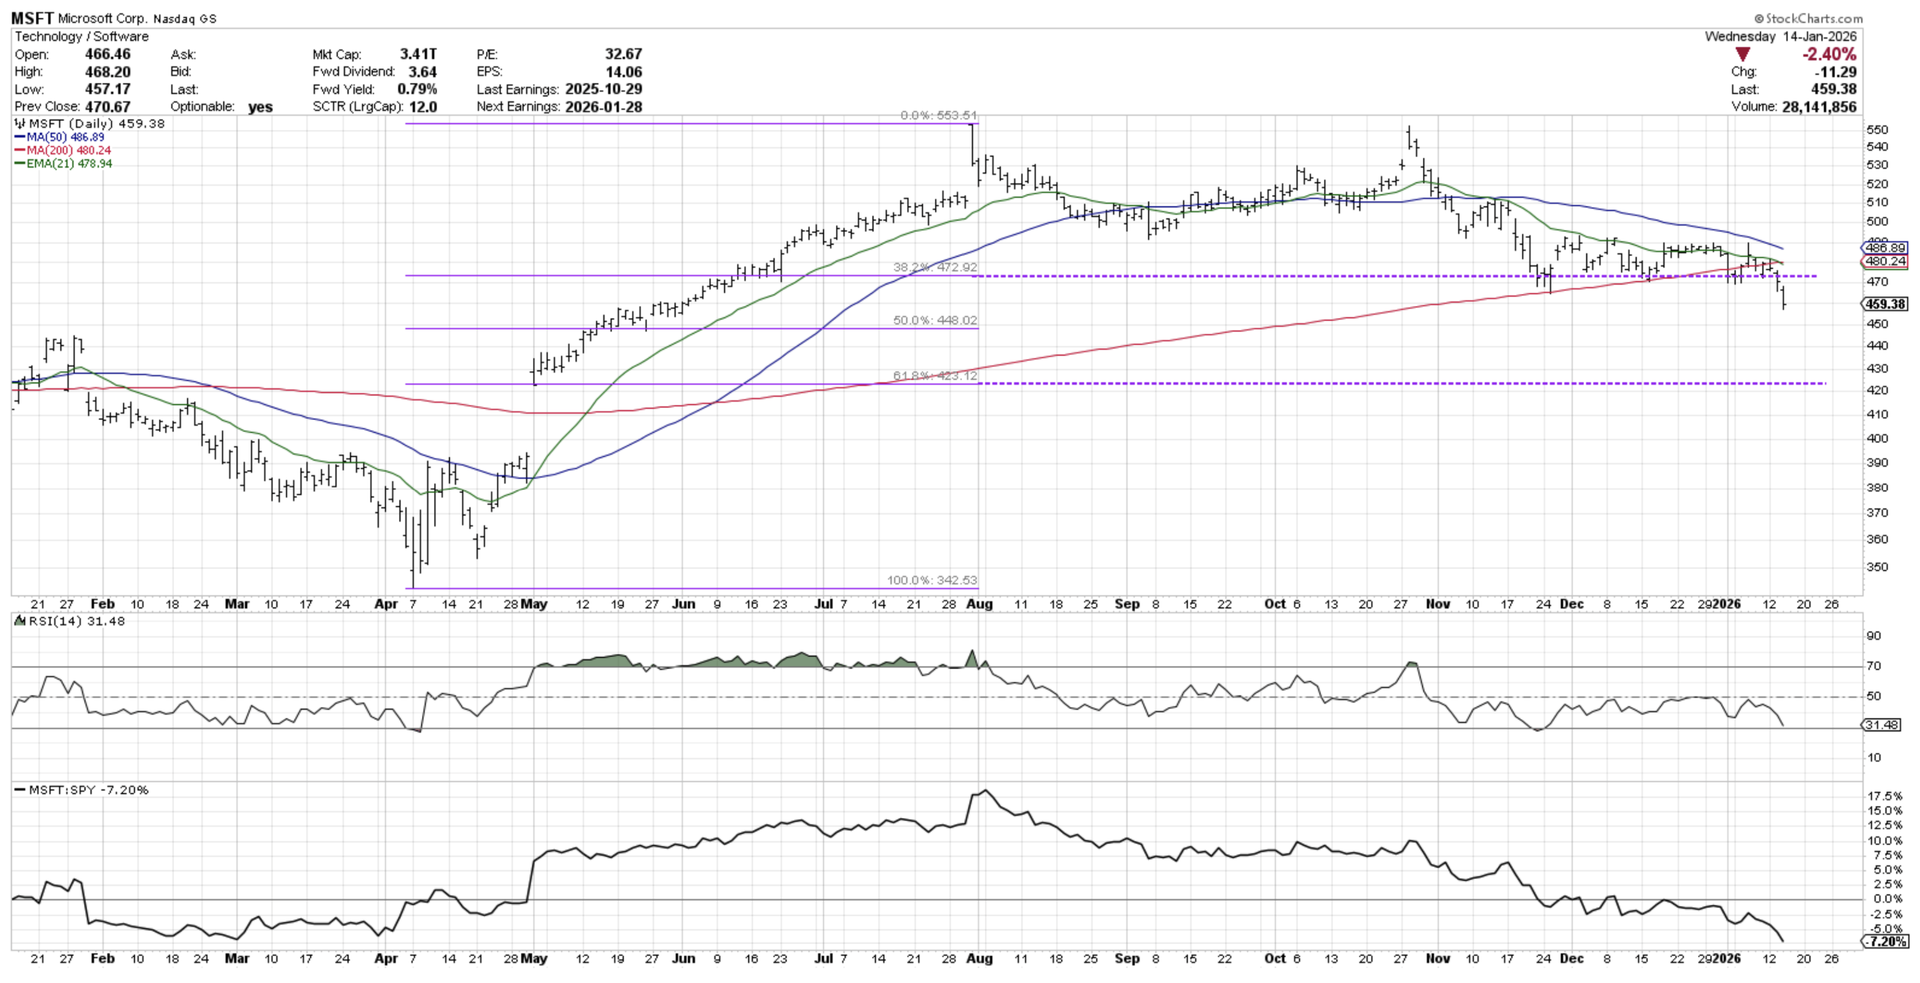
Microsoft’s October peak ended up creating a clear double top pattern for the technology leader, followed soon after by a pullback to the 200-day moving average. Using the April low and July high as a framework, we can see that the drop to the 200-day moving average in November also lined up with the 38.2% retracement level.
After bouncing off this “confluence of support” in December, Microsoft appears to have finally broken down to a new swing low this week. After Tuesday’s initial break of support, the further down move on Wednesday served as a downside follow-through day which implies the downturn has not reached a climax. A 61.8% retracement would mean a move down to around $425, representing a 24% loss from the July 2025 all-time high.

Bearish Divergence Hints at Top for Delta Air Lines
After Delta Air Lines (DAL) reported earnings on Tuesday, the stock broke below the 21-day exponential moving average. But before the airline dropped down through this initial stop loss level, a bearish momentum divergence served as an early warning of a potential downturn.
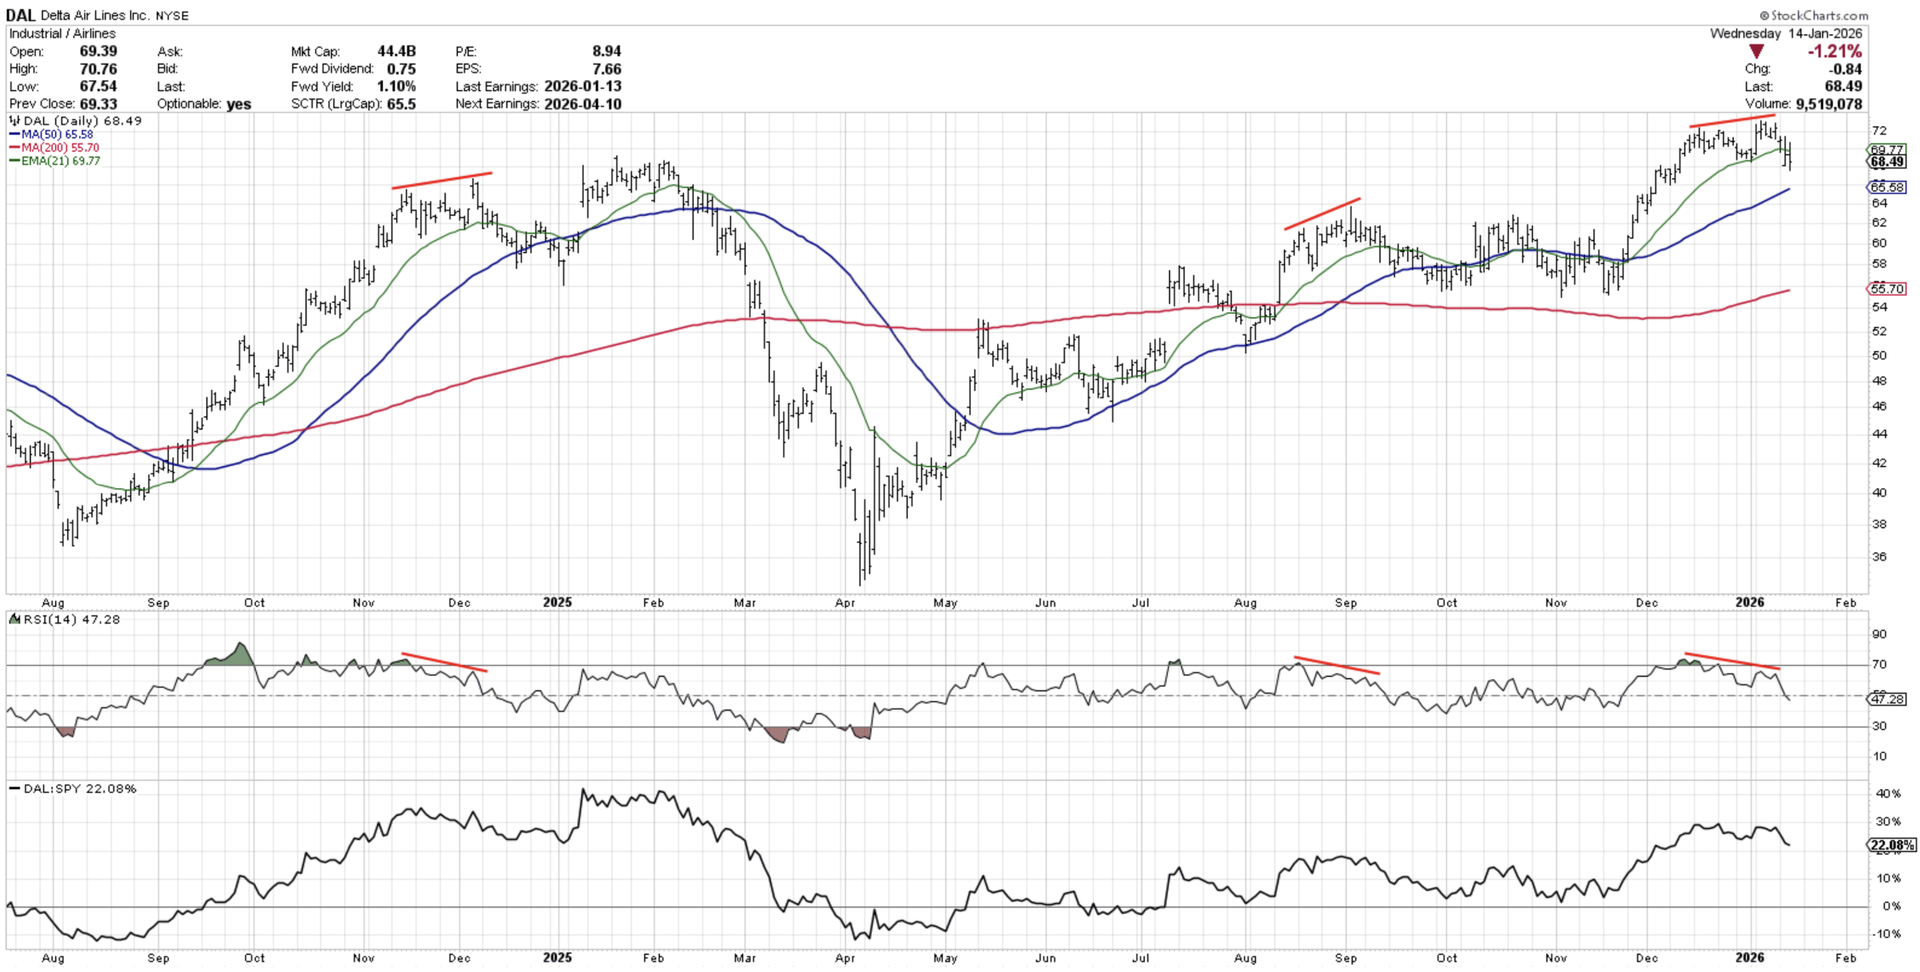
DAL has experienced a series of bearish momentum divergences at major tops over the last 18 months, formed by higher price action combined with lower peaks in price momentum. Short-term tops in December 2024 and September 2025 were both preceded by this ominous technical configuration.
Will the recent signal lead to another short-term pullback, or instead will we see a more significant bear phase? The RSI itself could serve as an important way of validating the length and depth of a new downtrend. After those previous divergences, the RSI held the 40 level on pullbacks. The more painful corrective phase in Q1 2025 saw the RSI push below 40 soon after the peak, serving to confirm a more extended bearish move.

David Keller, CMT is a past president of the CMT Association, a CNBC Contributor, and President and Chief Strategist at Sierra Alpha Research. Dave recaps market activity and interviews leading experts on his “Market Misbehavior” YouTube channel. He has served as Managing Director of Research at Fidelity Investments, Chief Market Strategist at StockCharts, and Application Specialist at Bloomberg.
Shared content and posted charts are intended to be used for informational and educational purposes only. CMT Association does not offer, and this information shall not be understood or construed as, financial advice or investment recommendations. The information provided is not a substitute for advice from an investment professional. CMT Association does not accept liability for any financial loss or damage our audience may incur.
