| Investopedia is partnering with CMT Association on this newsletter. The contents of this newsletter are for informational and educational purposes only, however, and do not constitute investing advice. The guest authors, which may sell research to investors, and may trade or hold positions in securities mentioned herein do not represent the views of CMT Association or Investopedia. Please consult a financial advisor for investment recommendations and services. |
Post Exhaustion Setups
Distinguishing between a pullback and a distribution phase requires a multi-layered diagnostic. Volume and price behavior post-exhaustion differences are as follows. In a pullback scenario, prices will retrace only modestly between 10-30% with declining volume. Prices will often find support at prior breakout levels or moving averages with buyers reemerging quickly forming higher lows. Distributions are different. OKLO is an example of such. Prices display large and persistent bearish candles and ranges often close to the downside. There have been eleven large bearish candles from the high reached by OKLO. Notice that it is below 20 day moving averages which should have acted as support but has turned into resistance. It has displayed lower highs and multiple failed breakouts with supply overwhelming demand. If it also fails to trade above the 100 day moving average, it will lead to more momentum selling. The breach of more than 30% declines from the highs is also significant showing OKLO is in a distribution phase.

Failed bounces would trigger more short selling and any attempt for rebounds are likely good setups for selling off. Careful.
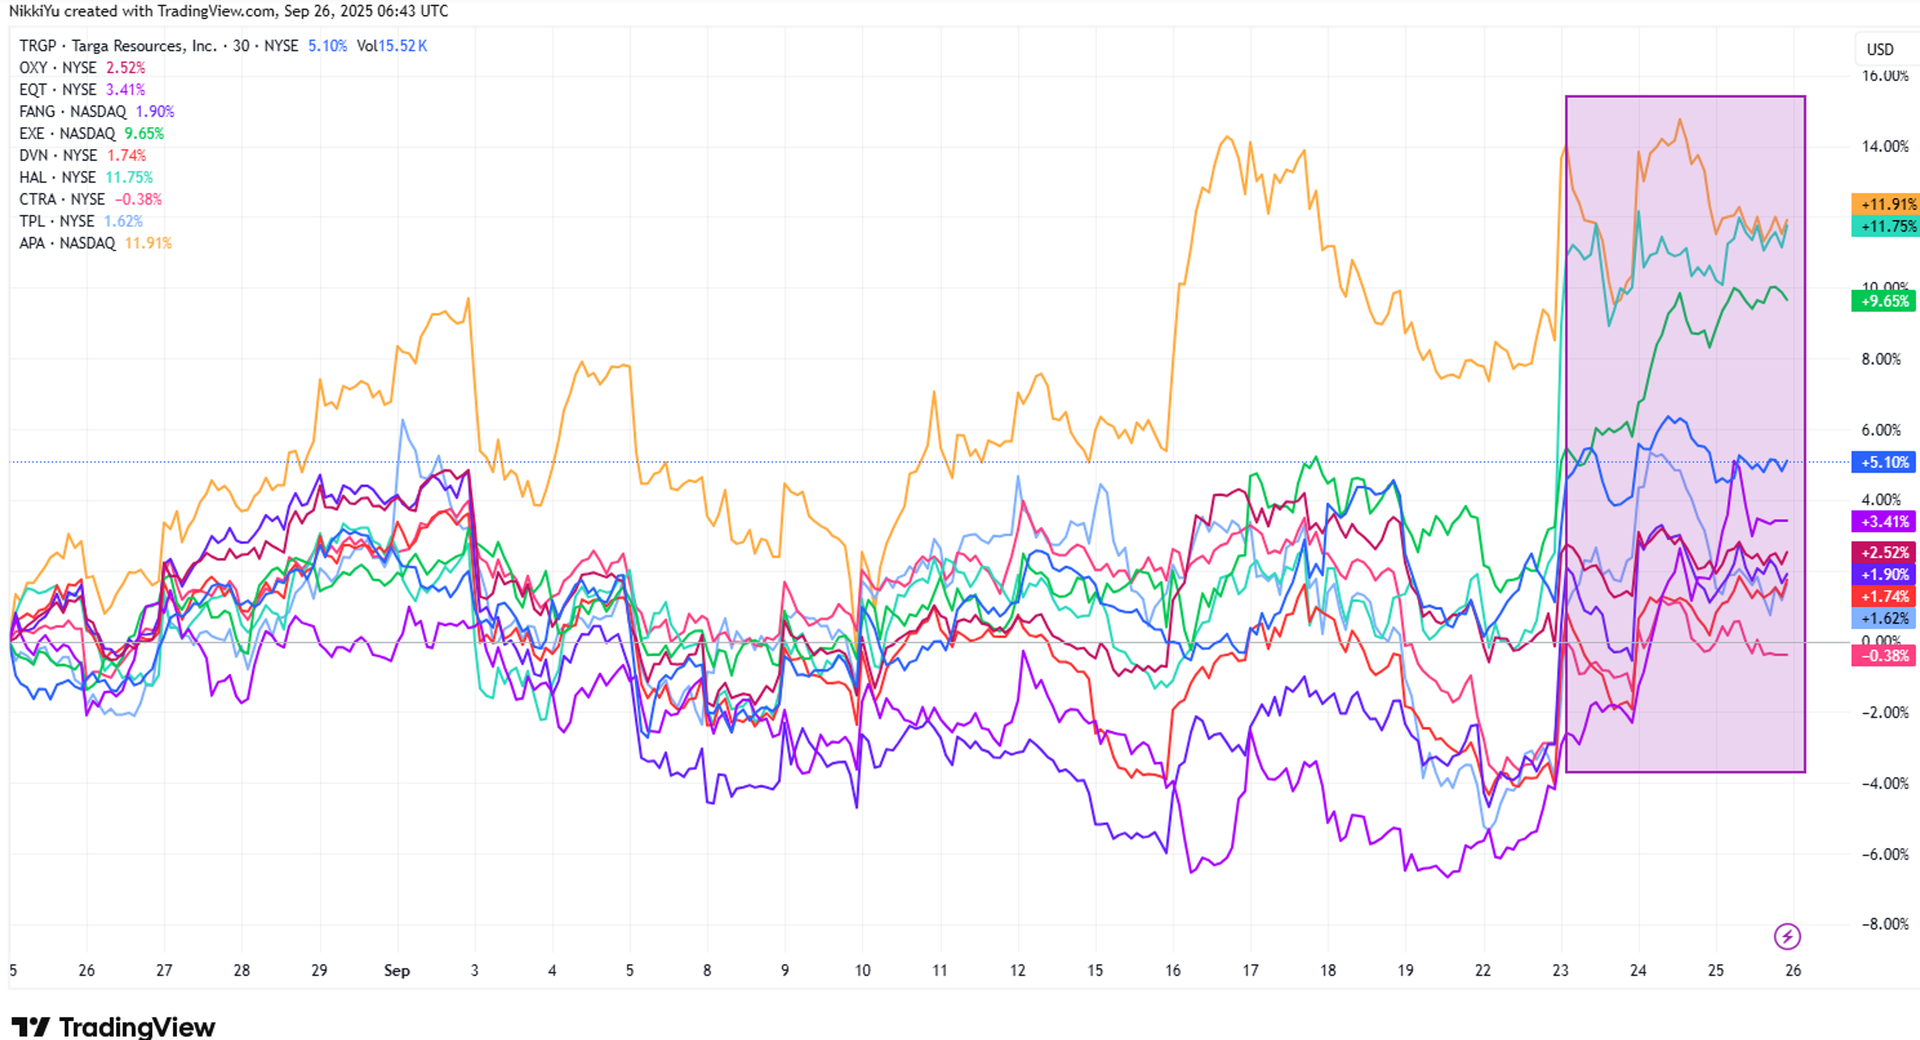
Distribution of URA and NLR Sector
Distribution across multiple stocks in the same group often signals institutional rotation. This is common in late-stage bull markets or macro regime shifts. When fewer stocks in the group are making new highs while others roll over, it signals internal exhaustion. In our previous article released on September 26, 2025, we have shown spinning tops and dojis signaling reversal candles across many sectors from gold, silver and uranium prompting for us to give a sell recommendation. We continue to see sell signals in a broad profit taking move for many growth stocks such as the $URA and $NLR which benefitted from the surge in capital flows for nuclear related ETFs.

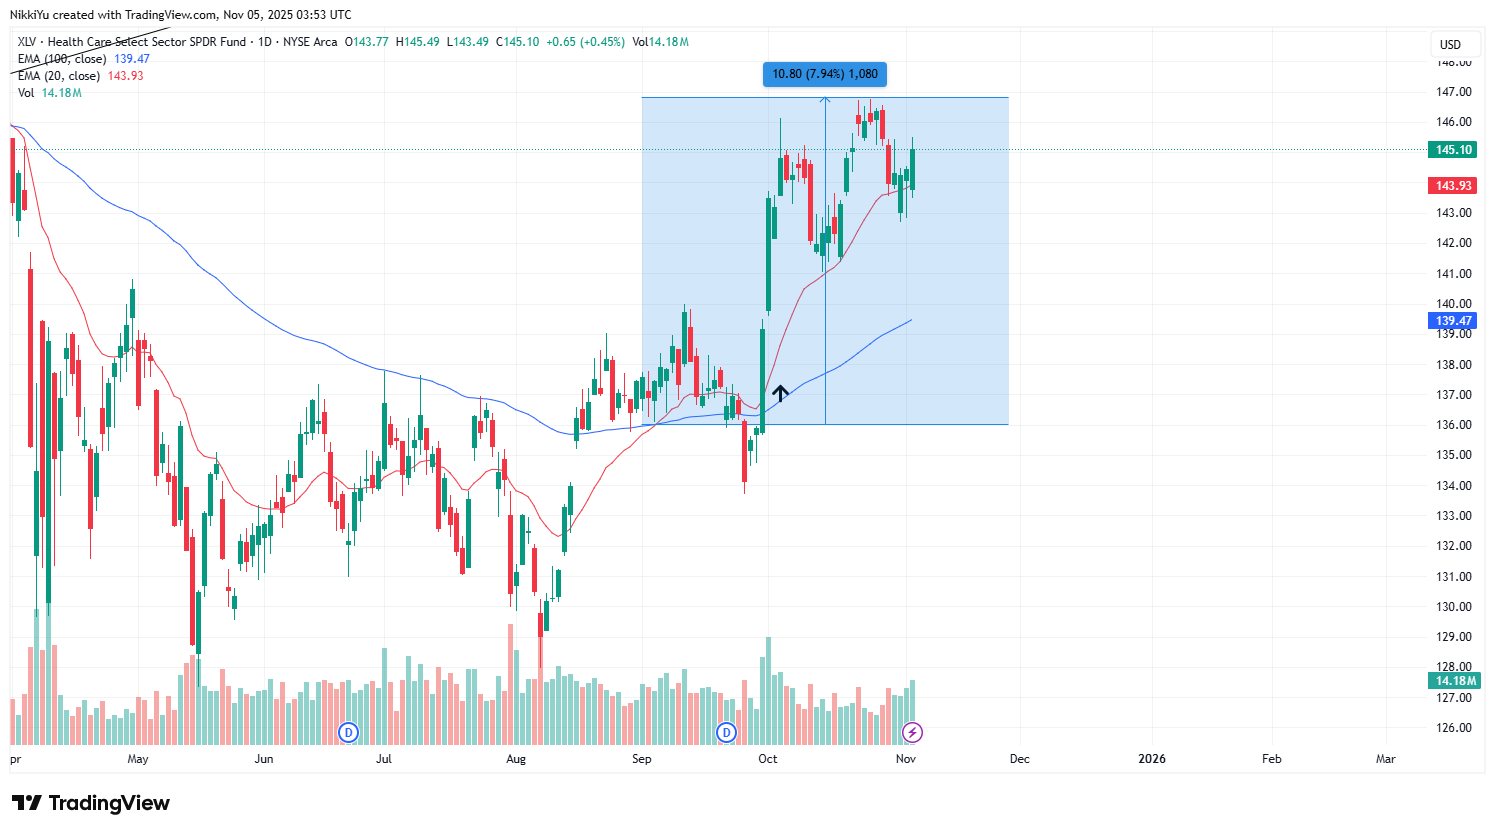
Shift Toward Defensive Liquid and Diversified Assets such as $XLV Healthcare
Just as we have advised to lock in significant profits on speculative assets in our September 2025 articles, when systemic derisking and macro-driven selling emerge, investors should prioritize capital preservation, reassess risk exposure, and shift toward defensive, liquid, and diversified assets. Review your margin and leverage, reduce if necessary to avoid forced liquidations. We favor low volatility sectors such as healthcare names while being ready to re-enter selectively when volatility stabilizes and leadership emerges. Note the 7% outperformance over the last 2 months of healthcare as a beneficiary of sector rotation, while the growth market darlings have been sold stealthily across the same time period.

Nikki Yu Gillo, CMT is a Philippine Chapter Chair of the CMT Association. She has over 20 years of experience working in Wealth Securities Inc. and runs a private investor community called Awesome10X. She can be reached at [email protected]

Shared content and posted charts are intended to be used for informational and educational purposes only. CMT Association does not offer, and this information shall not be understood or construed as, financial advice or investment recommendations. The information provided is not a substitute for advice from an investment professional. CMT Association does not accept liability for any financial loss or damage our audience may incur.
