By Todd Stankiewicz, CMT, CFP, ChFC with SYKON Capital
| Investopedia is partnering with CMT Association on this newsletter. The contents of this newsletter are for informational and educational purposes only, however, and do not constitute investing advice. The guest authors, which may sell research to investors, and may trade or hold positions in securities mentioned herein do not represent the views of CMT Association or Investopedia. Please consult a financial advisor for investment recommendations and services. |
1/ Gold ETF Signals Potential Reversal After Epic Rally
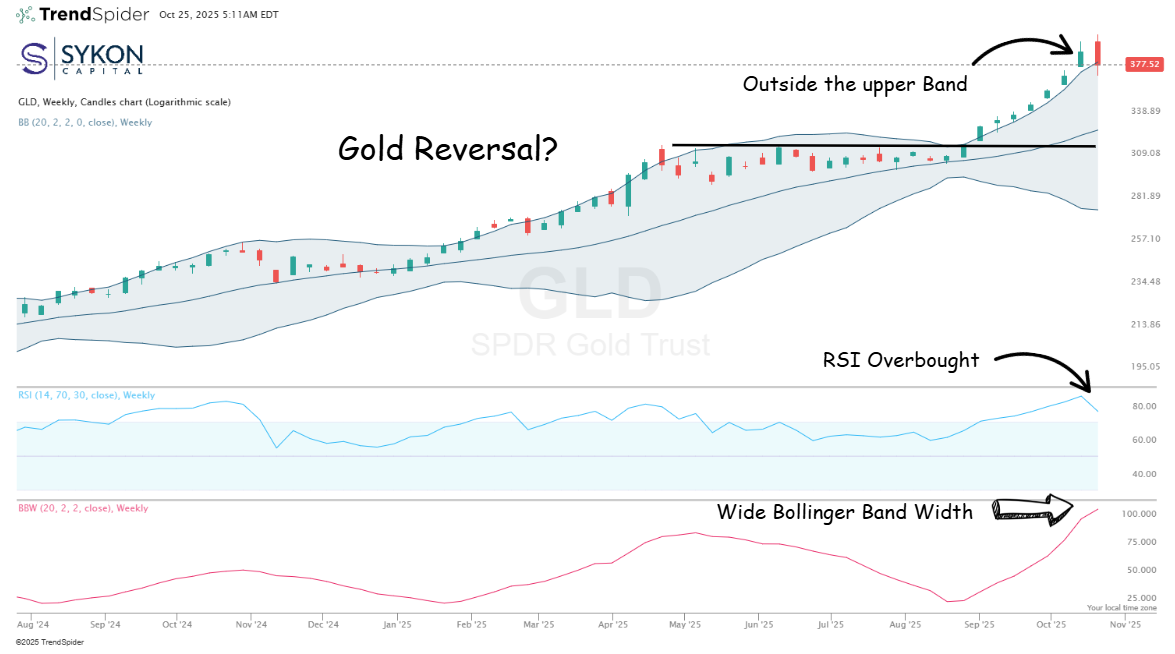
The SPDR Gold ETF (GLD) has delivered an extraordinary run alongside gold’s recent surge, but technical indicators now suggest a potential blow-off top and reversal may be underway. Several key warning signs have emerged on GLD’s weekly chart. The Relative Strength Index (RSI) recently peaked at extremely overbought levels above 85, while price action pushed beyond the upper Bollinger Band, indicating a move exceeding two standard deviations from the mean. The Bollinger Bands themselves have widened significantly, a pattern that historically precedes market resets. Most concerning is last week’s attempt at a bearish engulfing candlestick pattern, which often signals trend reversals after extended rallies. Technically last week’s candle came up a point short. This technical setup would suggest gold prices may be headed lower in the near term. If this reversal scenario plays out, historical patterns indicate GLD will likely retreat to test recent support levels. The most probable target sits around the middle Bollinger Band near $328, representing approximately a 15% decline from current levels, roughly 50 points lower. This congestion zone has provided support during previous pullbacks and would represent a healthy consolidation after such a powerful advance. For gold investors and traders, this technical deterioration warrants heightened vigilance. Nothing moves in a straight line forever, and even the strongest trends require periodic resets. Risk management becomes crucial in this environment; ensure position sizes are appropriate for potential volatility, consider taking partial profits if you’re sitting on substantial gains, and avoid chasing momentum at these extended levels. Whether you’re a long-term gold bull or a tactical trader, respecting these technical warning signals can help preserve capital and create better entry opportunities if the anticipated pullback materializes.
2/ Fed Rate Cuts: Be Careful What You Wish For
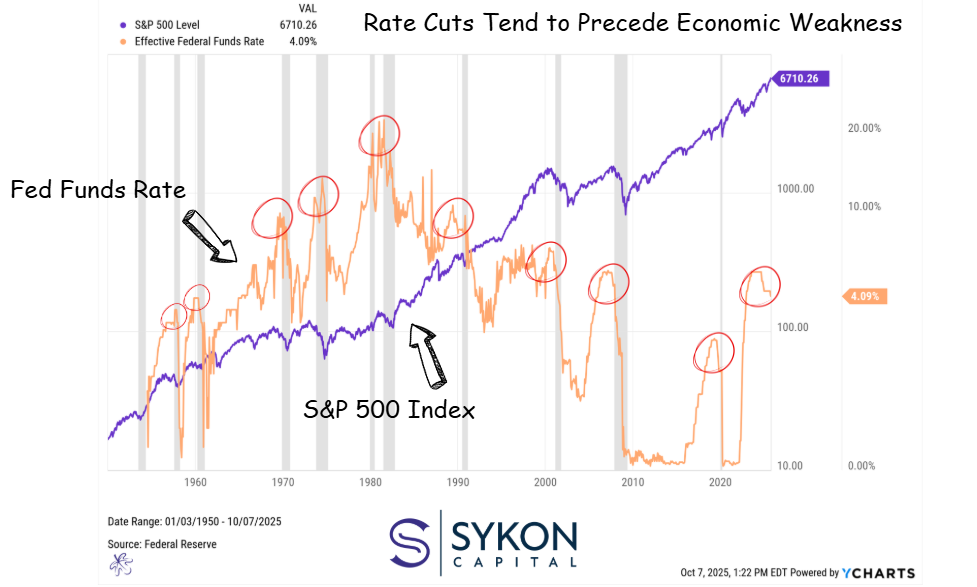
Friday’s inflation report showed CPI rising 3.0% annually, below the expected 3.1%, sparking a market rally as investors celebrated the likelihood of continued Federal Reserve rate cuts (U.S. BLS). Markets are now pricing in near-certainty that the Fed will cut rates by 25 basis points at this week’s October 28-29 meeting (Investopedia). But this enthusiasm may be misplaced. History offers a sobering reminder: Fed rate-cutting cycles are rarely cause for celebration. The chart of Fed rate cuts overlaid with recession periods (marked in grey) tells a compelling story. Most rate-cutting cycles don’t occur because the economy is robust and expanding, they happen because the Federal Reserve is responding to emerging cracks in economic foundations. Rate cuts typically precede or accompany economic weakness, often followed by the market volatility that characterizes recessionary environments. This pattern makes intuitive sense. The Fed doesn’t slash rates when everything is going well. They cut rates when the labor market softens, when growth slows, or when financial conditions tighten enough to threaten economic stability. Fed officials have explicitly stated they’re cutting rates due to concerns about weakness in the labor market, not because inflation has been fully conquered (Investopedia). Current conditions echo this historical pattern. While inflation has moderated from its peaks, it remains above the Fed’s 2% target. Meanwhile, job growth has decelerated sharply, and unemployment insurance claims are rising. The Fed finds itself in the uncomfortable position of cutting rates not from strength, but from necessity. For investors, this context matters enormously. Rather than viewing rate cuts as an unambiguous positive, consider what they signal about underlying economic health. Consider positioning portfolios respectively, maintain adequate cash reserves, and prepare for potential volatility ahead. I’ve said it before and I’ll say it again: be careful what you wish for.
3/ S&P 500 Shows Bearish Divergence Despite New Highs
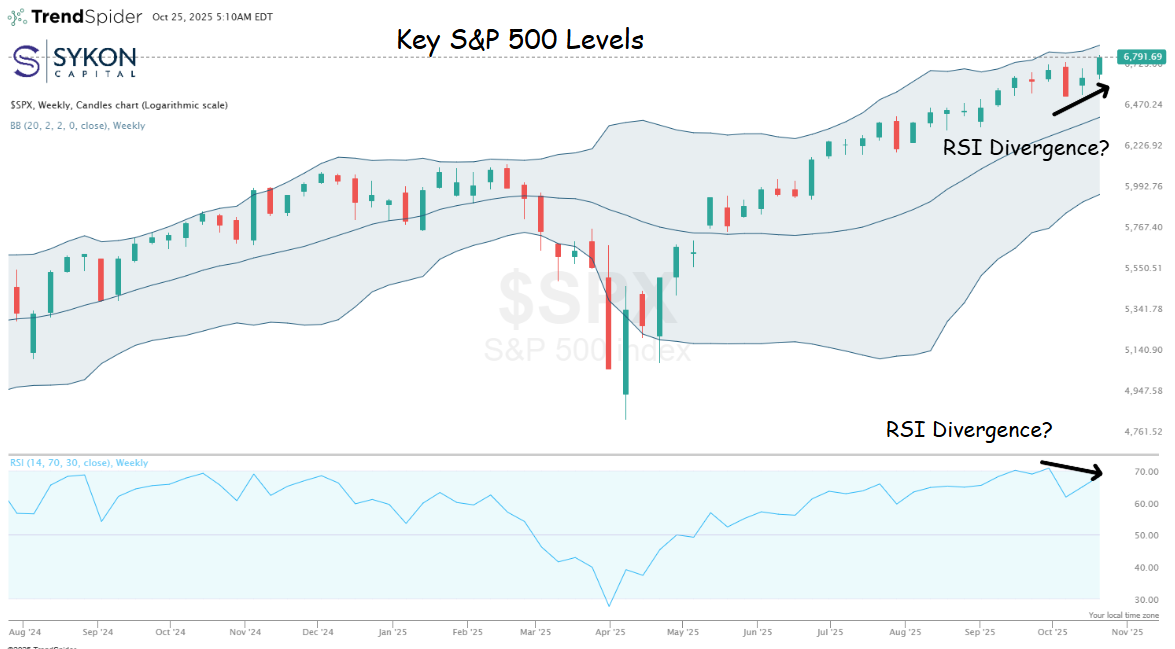
The S&P 500 will be closely watched this week as markets digest the Fed’s rate decision and respond to Friday’s encouraging inflation data. While the index continues riding the upper Bollinger Band, typically a sign of healthy momentum and a strong rally, troubling technical signals are emerging beneath the surface. The most concerning development is a bearish divergence in the Relative Strength Index (RSI). On Friday, the S&P 500 made a new price high, but the RSI failed to confirm with a corresponding new high. This divergence often precedes corrections, as it suggests weakening momentum despite rising prices. Additionally, RSI readings are approaching overbought territory, further increasing the probability of a near-term pullback. If a correction materializes, there are two key support levels to monitor. The first target would be the middle Bollinger Band around 6,422 (based on Friday’s close), representing approximately a 370-point decline or about 5% from current levels. This would constitute a normal, healthy pullback within an ongoing uptrend. However, if selling pressure intensifies and the index breaks below the middle Bollinger Band, the next logical target becomes the lower Bollinger Band near 5,597. This scenario would represent an approximately 800-point decline, roughly 12% from current levels. To be clear: these potential pullbacks don’t necessarily signal the start of a new bear market. Rather, they represent normal corrective behavior after extended rallies. The key for investors is proper risk management; take profits when appropriate, maintain disciplined position sizing, and ensure your portfolio can withstand normal market volatility without forcing emotional decisions.


Advisory Services offered through SYKON Capital LLC, a registered investment advisor with the U.S. Securities and Exchange Commission. This material is intended for informational purposes only. It should not be construed as legal or tax advice and is not intended to replace the advice of a qualified attorney or tax advisor. The information contained in this presentation has been compiled from third party sources and is believed to be reliable as of the date of this report. Past performance is not indicative of future returns and diversification neither assures a profit nor guarantees against loss in a declining market. Investments involve risk and are not guaranteed.

Shared content and posted charts are intended to be used for informational and educational purposes only. CMT Association does not offer, and this information shall not be understood or construed as, financial advice or investment recommendations. The information provided is not a substitute for advice from an investment professional. CMT Association does not accept liability for any financial loss or damage our audience may incur.
