By Todd Stankiewicz, CMT, CFP, ChFC with SYKON Capital
| Investopedia is partnering with CMT Association on this newsletter. The contents of this newsletter are for informational and educational purposes only, however, and do not constitute investing advice. The guest authors, which may sell research to investors, and may trade or hold positions in securities mentioned herein do not represent the views of CMT Association or Investopedia. Please consult a financial advisor for investment recommendations and services. |
Fed Day Whipsaw: Why the Close Matters More Than the Selloff
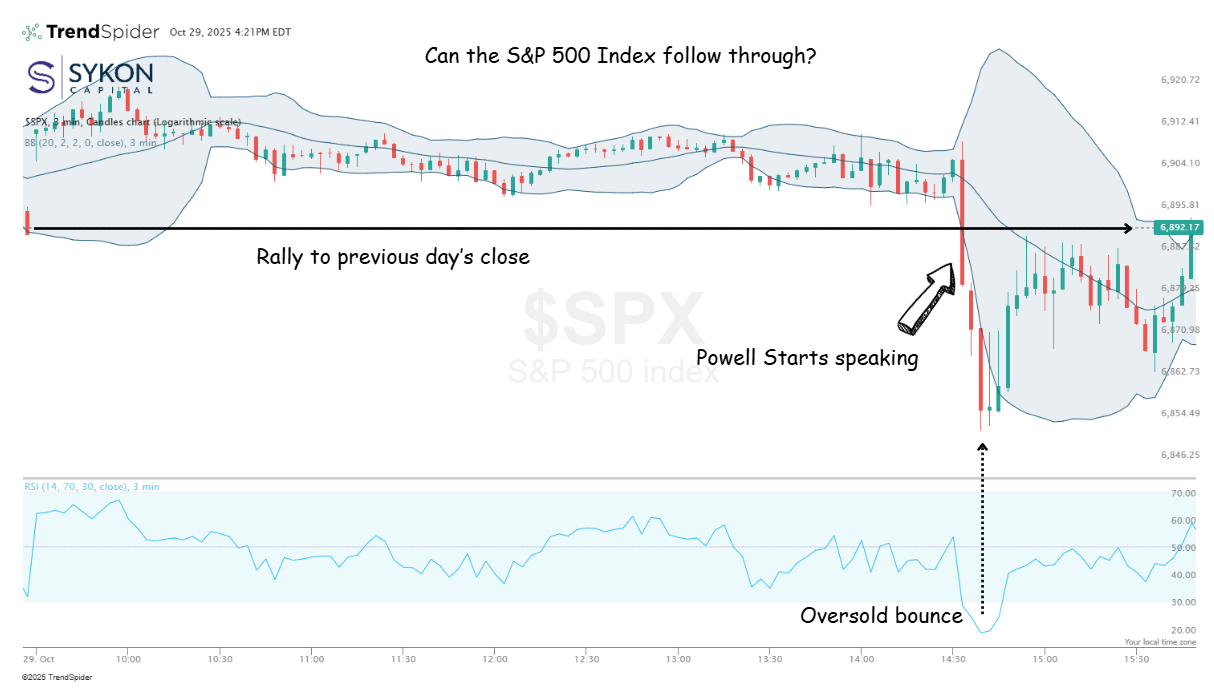
Yesterday’s Fed meeting delivered the expected quarter-point rate cut, bringing the benchmark rate to 3.75%-4%, but the real story was the intraday price action that followed. As usual with Fed days, the market was subdued heading into the 2:00 PM announcement, and the initial reaction was exactly what you’d expect, a brief rally as traders digested the second consecutive rate cut.
Then Powell started speaking at 2:30 PM, and things got interesting. We saw a massive red candle as the market sold off sharply, pushing the S&P 500 down to test the 6800 level where it moved into oversold territory. The technical setup at that point looked precarious, with the RSI flashing an oversold reading of 18 and price action moving outside the Bollinger Band. But here’s what matters: the market found support and staged a recovery into the close, ultimately finishing the day essentially flat.
That strong finish is the encouraging part. When you get that kind of intraday volatility, a sharp selloff followed by a recovery, it tells you something about underlying demand. The initial knee-jerk reactions to Powell’s comments about upside risks to inflation and downside risks to employment aren’t as telling as what happens in the hours that follow.
Markets digest, reassess, and show their hand.
The question now is whether we can build on that momentum. Can we reclaim the 6900 level and regain the technical strength we had before the Fed meeting? The next few sessions will be critical. If we see follow-through buying and push back above 6900, that strong finish yesterday becomes a launching pad. We’ll be watching closely to see if buyers step in and confirm that the late-day recovery was more than just short-covering.
10-Year Treasury Yields Spike as Powell Dampens Rate Cut Expectations
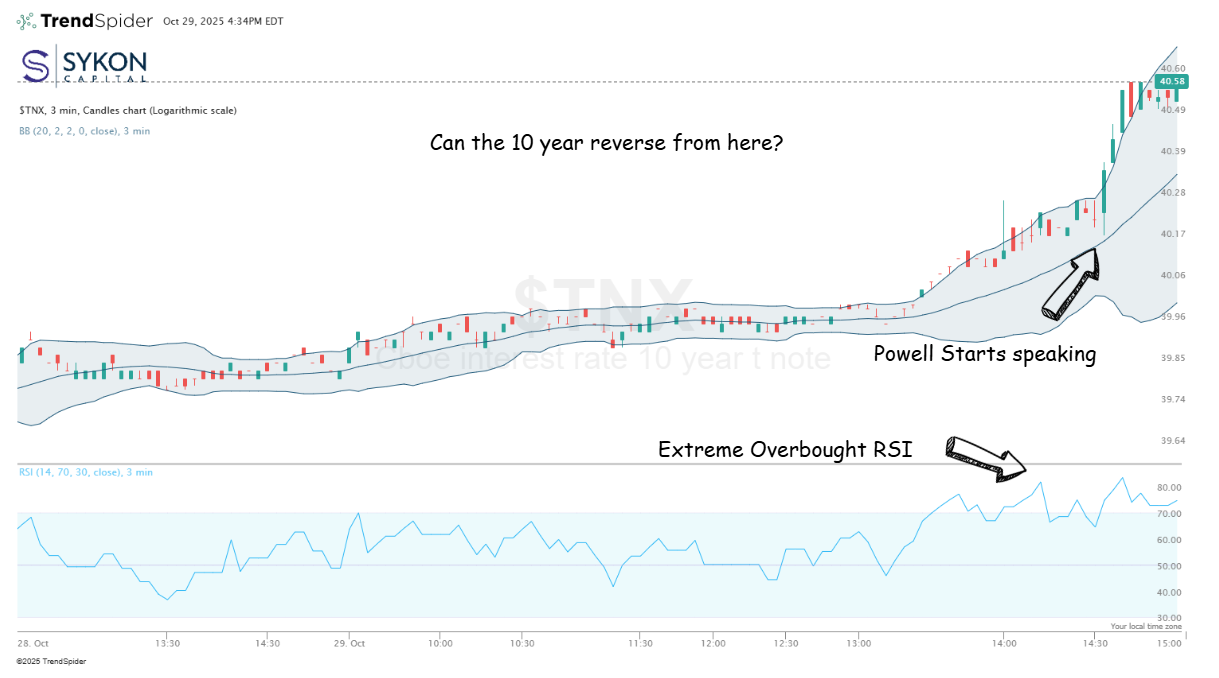
Today’s session in the 10-year Treasury market told a pretty clear story about where investor concerns are sitting right now. For most of the trading day, the 10-year yield stayed comfortably below the 4% level, hovering around that psychological floor that we’ve been watching closely. But when Fed Chair Powell started speaking at 2:30 PM following the Fed’s 25 basis point rate cut, the yield took off to the upside in a hurry.
The 10-year jumped nearly 10 basis points to around 4.06%, pushing into extremely overbought conditions.
I think a lot of what this spike is indicating is a concern around inflation. Powell made it pretty clear during his press conference that a December rate cut is “not a foregone conclusion” and that there are “strongly differing views” within the Fed about the next move.
According to the CME Group Fed Watch Tool, probabilities dropped from over 90% of a December rate cut to about 68%.
He also acknowledged that inflation risks remain, especially with the ongoing effects of tariffs working through the system. When the market was expecting a more dovish tone and instead got caution about future cuts, that’s when yields really spiked. It’s the market repricing the idea that rates might stay higher for longer if inflation doesn’t cooperate.
The positive thing is that we did start to see the yield pause in those overbought conditions. Just like when the S&P was oversold and we saw a bounce, we could potentially see these overbought conditions start to ease. But we don’t want to put too much stock in what happens with fixed income in just one day, just like with the equity market.
We’re going to be watching very closely what happens over the next few days. If you remember what I wrote about yesterday, the monthly or longer term charts indicated that there may be pressure to the downside, so we don’t want to judge too much here on the short term action. We’re keeping a very key eye on this 4.04 level and then ultimately where we gapped up right around the 4.03 level. Getting back into that sub 4% level is going to be very important from the market’s point of view.
UUP Reverses Course After Fed-Driven Dollar Spike
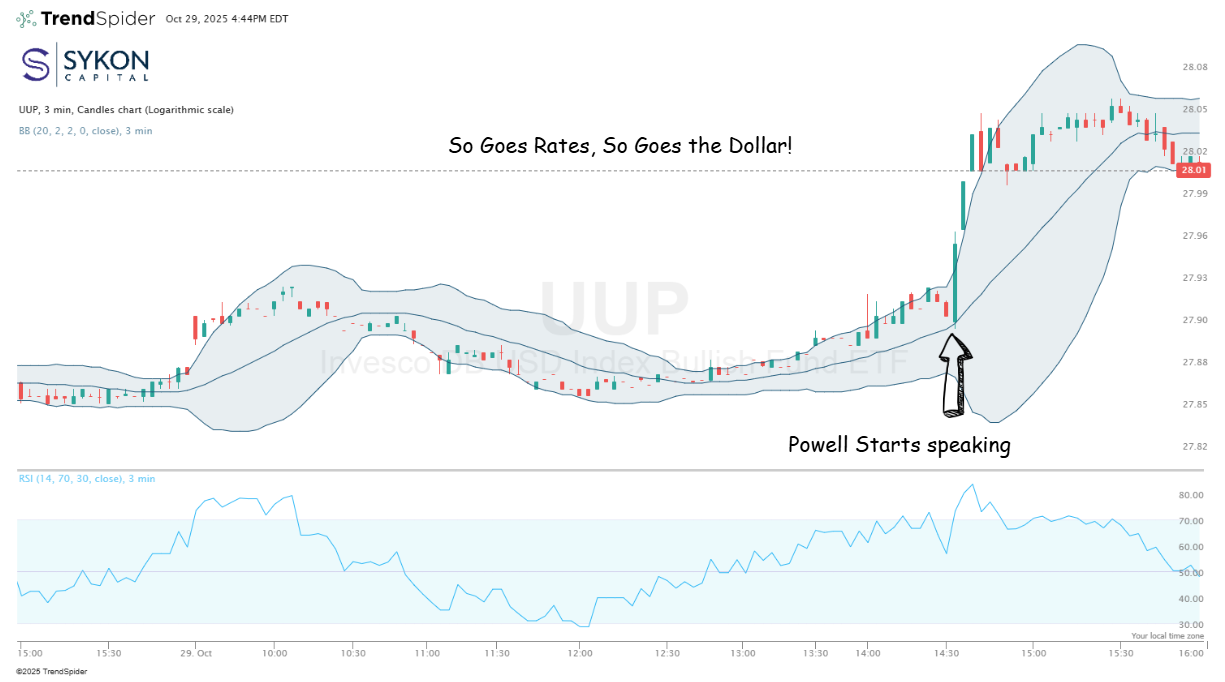
The Invesco DB US Dollar Index Bullish Fund (UUP) experienced dramatic intraday volatility Wednesday following the Federal Reserve’s quarter-point rate cut to 3.75%-4%, mirroring the whipsaw action seen in Treasury markets.
Initially, the dollar surged aggressively after Fed Chair Jerome Powell’s hawkish commentary dampened expectations for continued rate cuts. Powell explicitly stated that a December rate cut “is not a foregone conclusion (CNBC). Far from it,” revealing “strongly differing views” among committee members about the path forward (CNBC). This hawkish surprise triggered a sharp rally in UUP as markets repriced their rate cut expectations, pushing the ETF into overbought territory.
However, the rally proved short-lived. UUP subsequently stabliazed, falling to its lower Bollinger Band at 28.01, a key technical support level. The ETF now sits at a critical juncture. A breakdown below this support would also breach one of the major upside gaps from the recent rally, potentially signaling a move back to the levels prior to the FOMC new conference.
This price action underscores why traders should avoid jumping to conclusions based on initial Fed day reactions. The extreme volatility around monetary policy announcements often produces potentially false signals, making it essential to observe how price action develops in subsequent sessions.
Looking ahead, UUP faces two distinct scenarios. If support holds at the lower Bollinger Band, a retest of the upside could target the 28.06 level, suggesting renewed dollar strength that would align with potential firmness in interest rate markets. Conversely, a breakdown through current support would indicate that the dollar’s post-Fed spike was merely a temporary reaction, opening the door for further downside.
The coming sessions will reveal whether buyers step in to defend support or if follow-through selling materializes.

Todd Stankiewicz CMT, CFP, ChFC is the President and Chief Investment Officer of Harrison, N.Y. based SYKON Capital, where he manages portfolios for private clients, financial advisors and institutions focused on minimizing downside risk. He is also the Portfolio Manager of the Free Markets ETF (Ticker: FMKT). A member of the CMT Association since 2018, Todd has been a guest author for Chart Advisor since 2023. Learn more at www.SYKONCapital.com.
Advisory Services offered through SYKON Capital LLC, a registered investment advisor with the U.S. Securities and Exchange Commission. This material is intended for informational purposes only. It should not be construed as legal or tax advice and is not intended to replace the advice of a qualified attorney or tax advisor. The information contained in this presentation has been compiled from third party sources and is believed to be reliable as of the date of this report. Past performance is not indicative of future returns and diversification neither assures a profit nor guarantees against loss in a declining market. Investments involve risk and are not guaranteed.
Shared content and posted charts are intended to be used for informational and educational purposes only. CMT Association does not offer, and this information shall not be understood or construed as, financial advice or investment recommendations. The information provided is not a substitute for advice from an investment professional. CMT Association does not accept liability for any financial loss or damage our audience may incur.
