A Comparative Analysis of Global Returns and the Impending Upside Push
Investopedia is partnering with CMT Association on this newsletter. The contents of this newsletter are for informational and educational purposes only, however, and do not constitute investing advice. The guest authors, which may sell research to investors, and may trade or hold positions in securities mentioned herein do not represent the views of CMT Association or Investopedia. Please consult a financial advisor for investment recommendations and services
In continuation of my earlier article on the Nifty’s breakout potential, I want to highlight the significant divergence between India and the rest of the world over the past year. This performance gap suggests that the “coiled spring” for Indian equities is now tighter than ever.
The 2025 Global Divergence
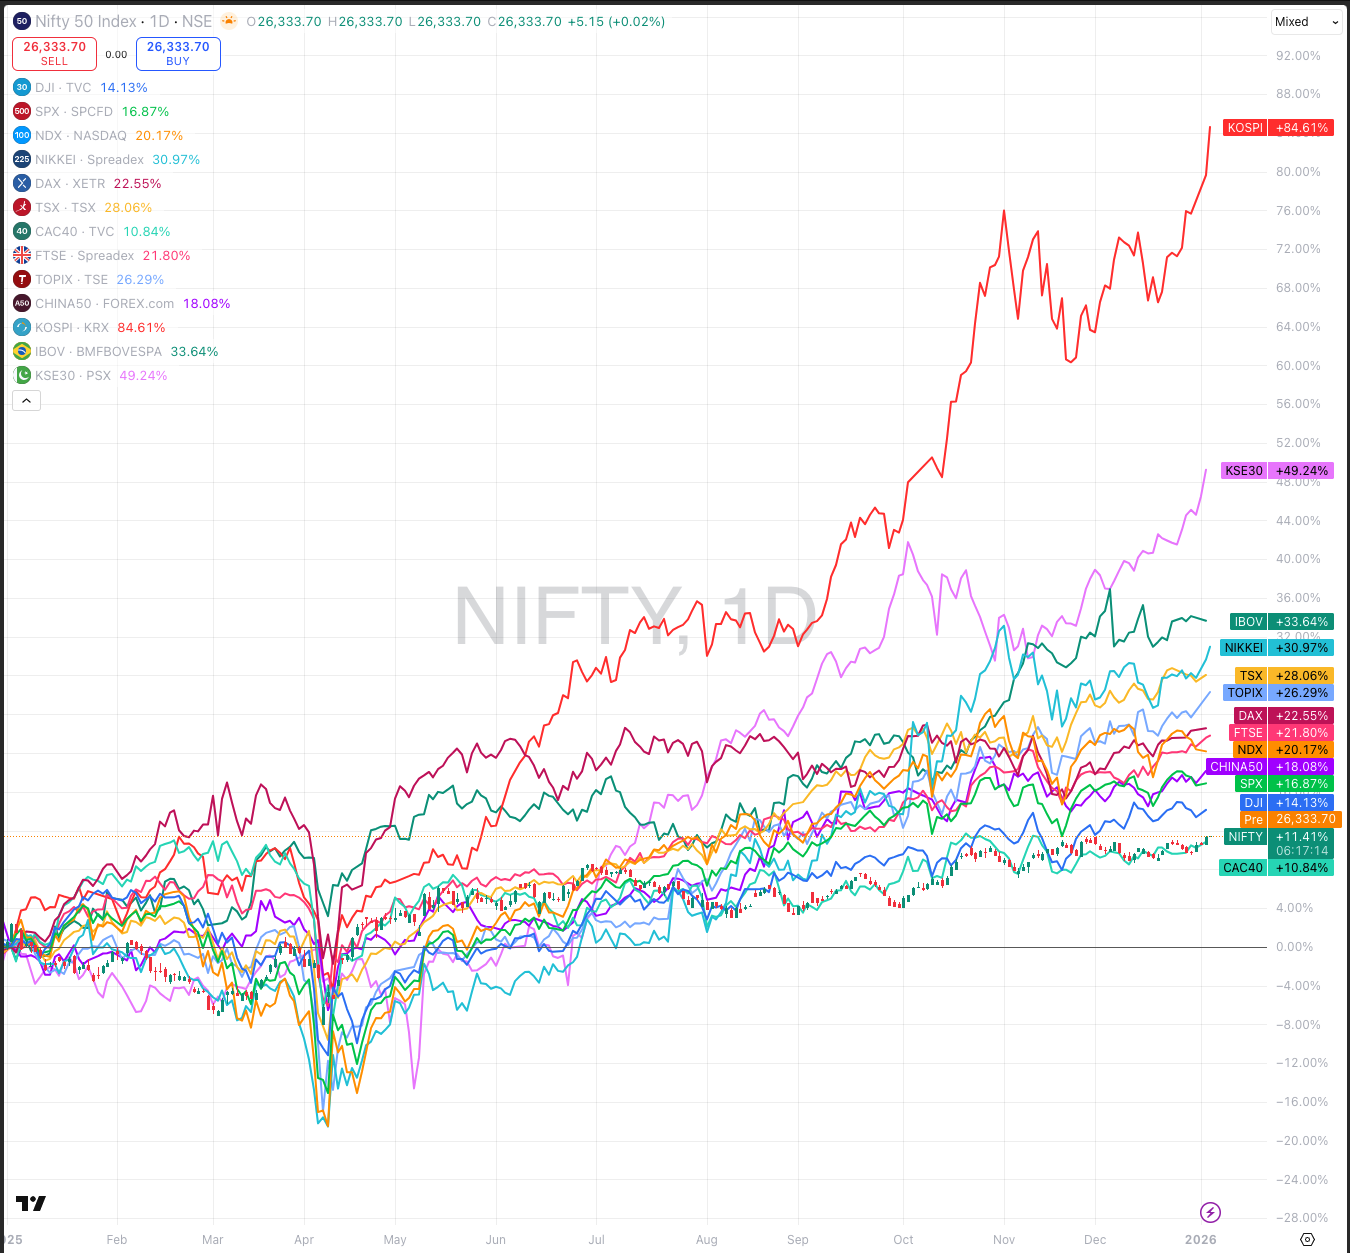
From the beginning of 2025 through the start of 2026, the Nifty 50 delivered a return of approximately 11%. While a double-digit gain is positive in isolation, it represents the worst performance among major global indices, trailing significantly behind its peers:
Asia & Emerging Markets: South Korea’s KOSPI (+84%), Japan’s Nikkei (+30%), and China’s Shanghai Composite (+18%) all substantially outperformed India.
The West: The tech-heavy Nasdaq (+21%) and the S&P 500 (+17%) continued their dominance.
Latin America: Brazil’s Bovespa surged nearly 34%.
The 15-Month Stall
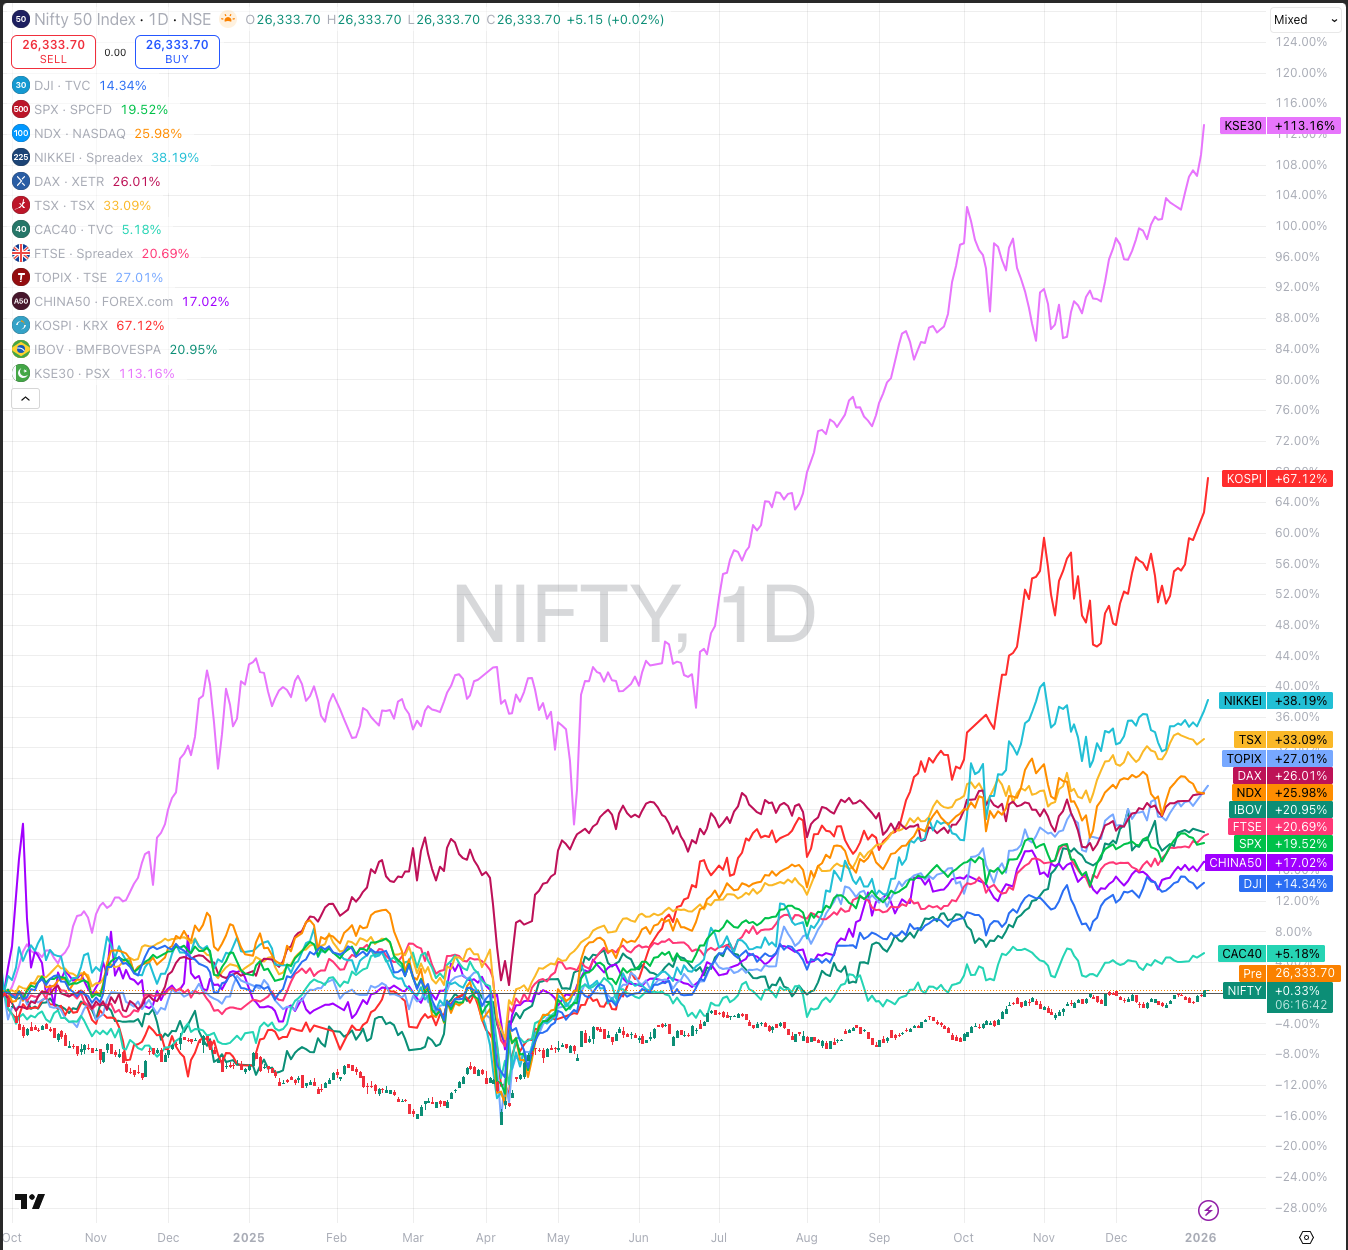
The underperformance is even more stark when looking at the period since the Nifty’s peak in September 2024 (and the broader consolidation since late 2024). The market has remained nearly flat for the last 15 months, leading to a massive “valuation reset.” While global prices soared, Indian stocks spent 2025 pricing in bad news—from slowing earnings momentum, a war, trade tariff uncertainties and a falling currency.
The “Dollar Trap”: Real Returns are Negative
The gap becomes even more telling when you overlap Nifty returns with USD/INR. Currency Drag: The INR fell by over 8% since September 2024, recently breaching the 90 level against the Dollar. The Result: For a global investor, the 10.5% domestic gain in 2025 was almost entirely wiped out by currency depreciation, resulting in a near-zero or negative return in Dollar terms in 2025 and a negative return compared to the peak of 2024.
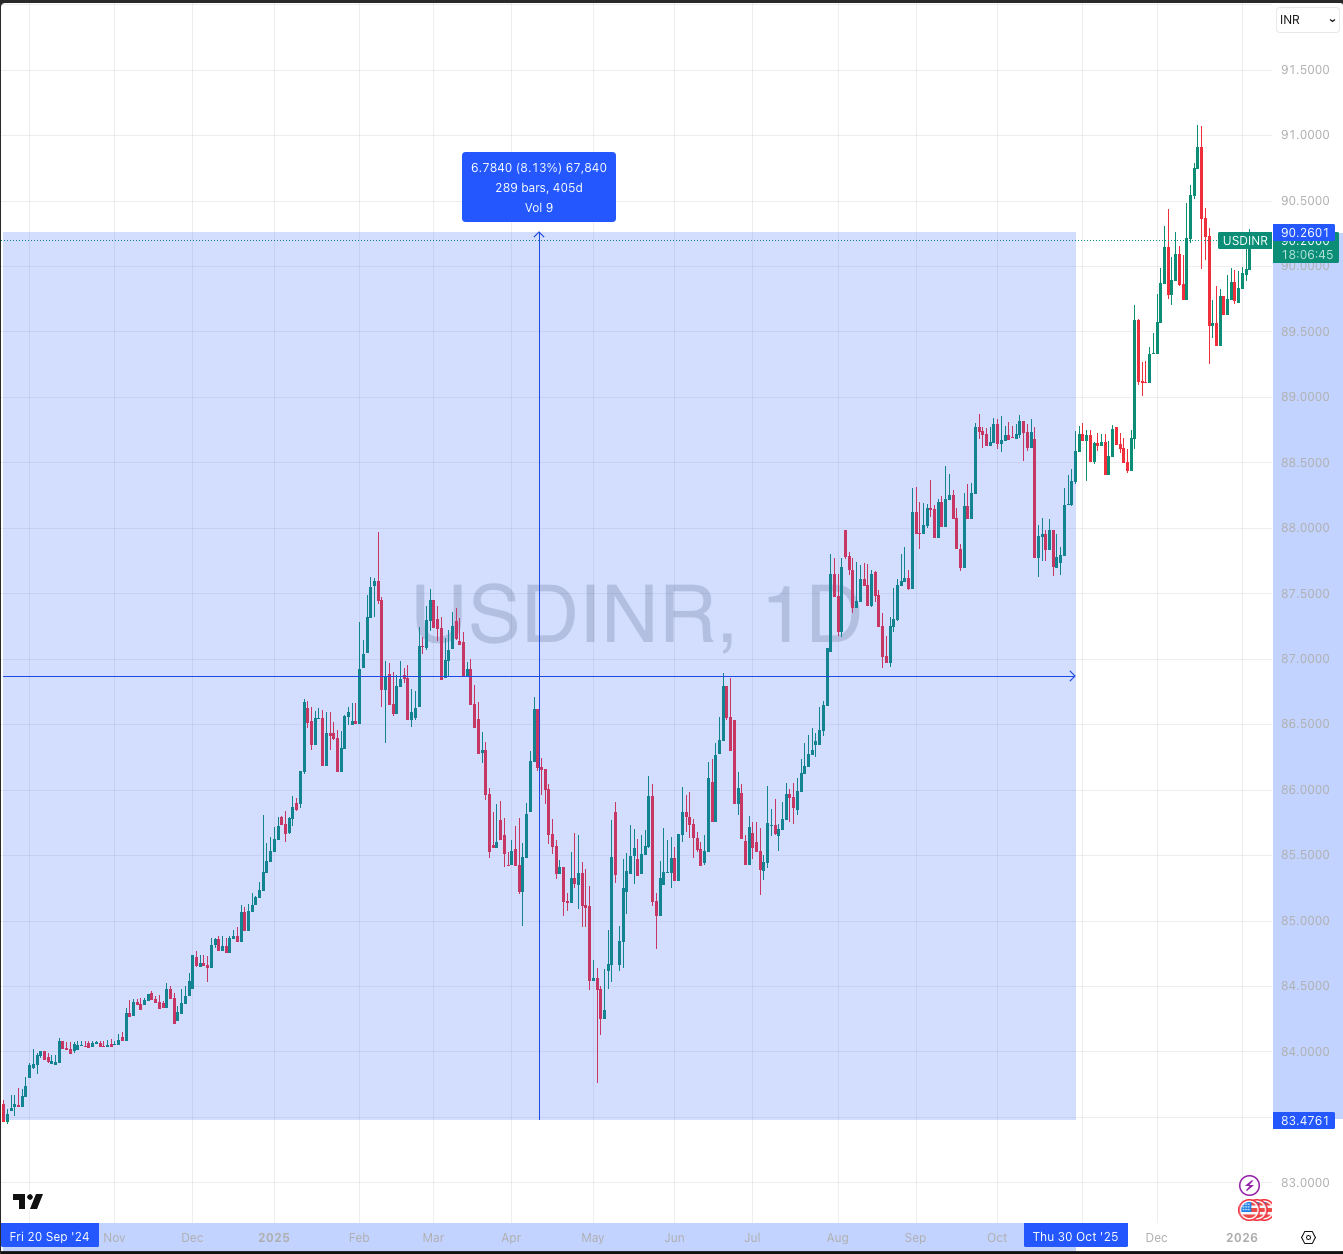
To add insult to injury, the DXY (US Dollar Index) actually lost more than 9% of its value since the beginning of 2025. Typically, a falling dollar is a “buy signal” for Emerging Markets. Because the INR failed to strengthen alongside the falling DXY, Indian stocks missed the massive “Dollar-return” bonus that benefited European and other Asian markets.

Most of the bad news for India is priced in and builds further on my case regarding an impending breakout. The macro factors around tariffs and earnings will drive the next push in Indian stocks. The current support above 26000 on Nifty will be an important level to watch out for. If that holds, the target of 29000 on Nifty will remain intact.
Why the Breakout is Impending
Most of the “bad news” for India—high valuations, FII outflows, and tariff concerns—is now fully priced in. The macro factors are shifting:
Support Level: The current support above 26,000 on the Nifty is the most important level to watch.
Valuations: India’s valuation premium over other Emerging Markets has finally reverted to its long-term average, making it attractive for the “catch-up” trade.
Target: If the 26,000 floor holds, the primary target of 29,000 on the Nifty remains firmly intact for 2026.

Mitesh Kumar, CMT is part of the India Core Team for CMT Association, serving as the Delhi & NCR Chapter Lead. An experienced algo trader, he specializes in building systematic quantitative strategies and also coaches individuals on achieving financial independence. As an instructor with Yubha, he is currently focused on supporting the growth of the CMT community in India.
Shared content and posted charts are intended to be used for informational and educational purposes only. CMT Association does not offer, and this information shall not be understood or construed as, financial advice or investment recommendations. The information provided is not a substitute for advice from an investment professional. CMT Association does not accept liability for any financial loss or damage our audience may incur.
