- 1/ Copper vs
- Gold The Copper/Gold ratio and U.S
- 10-year Treasury yield have historically moved in tandem
- But since COVID, that relationship has weakened—yields surged on inflation and Fed tightening, […]
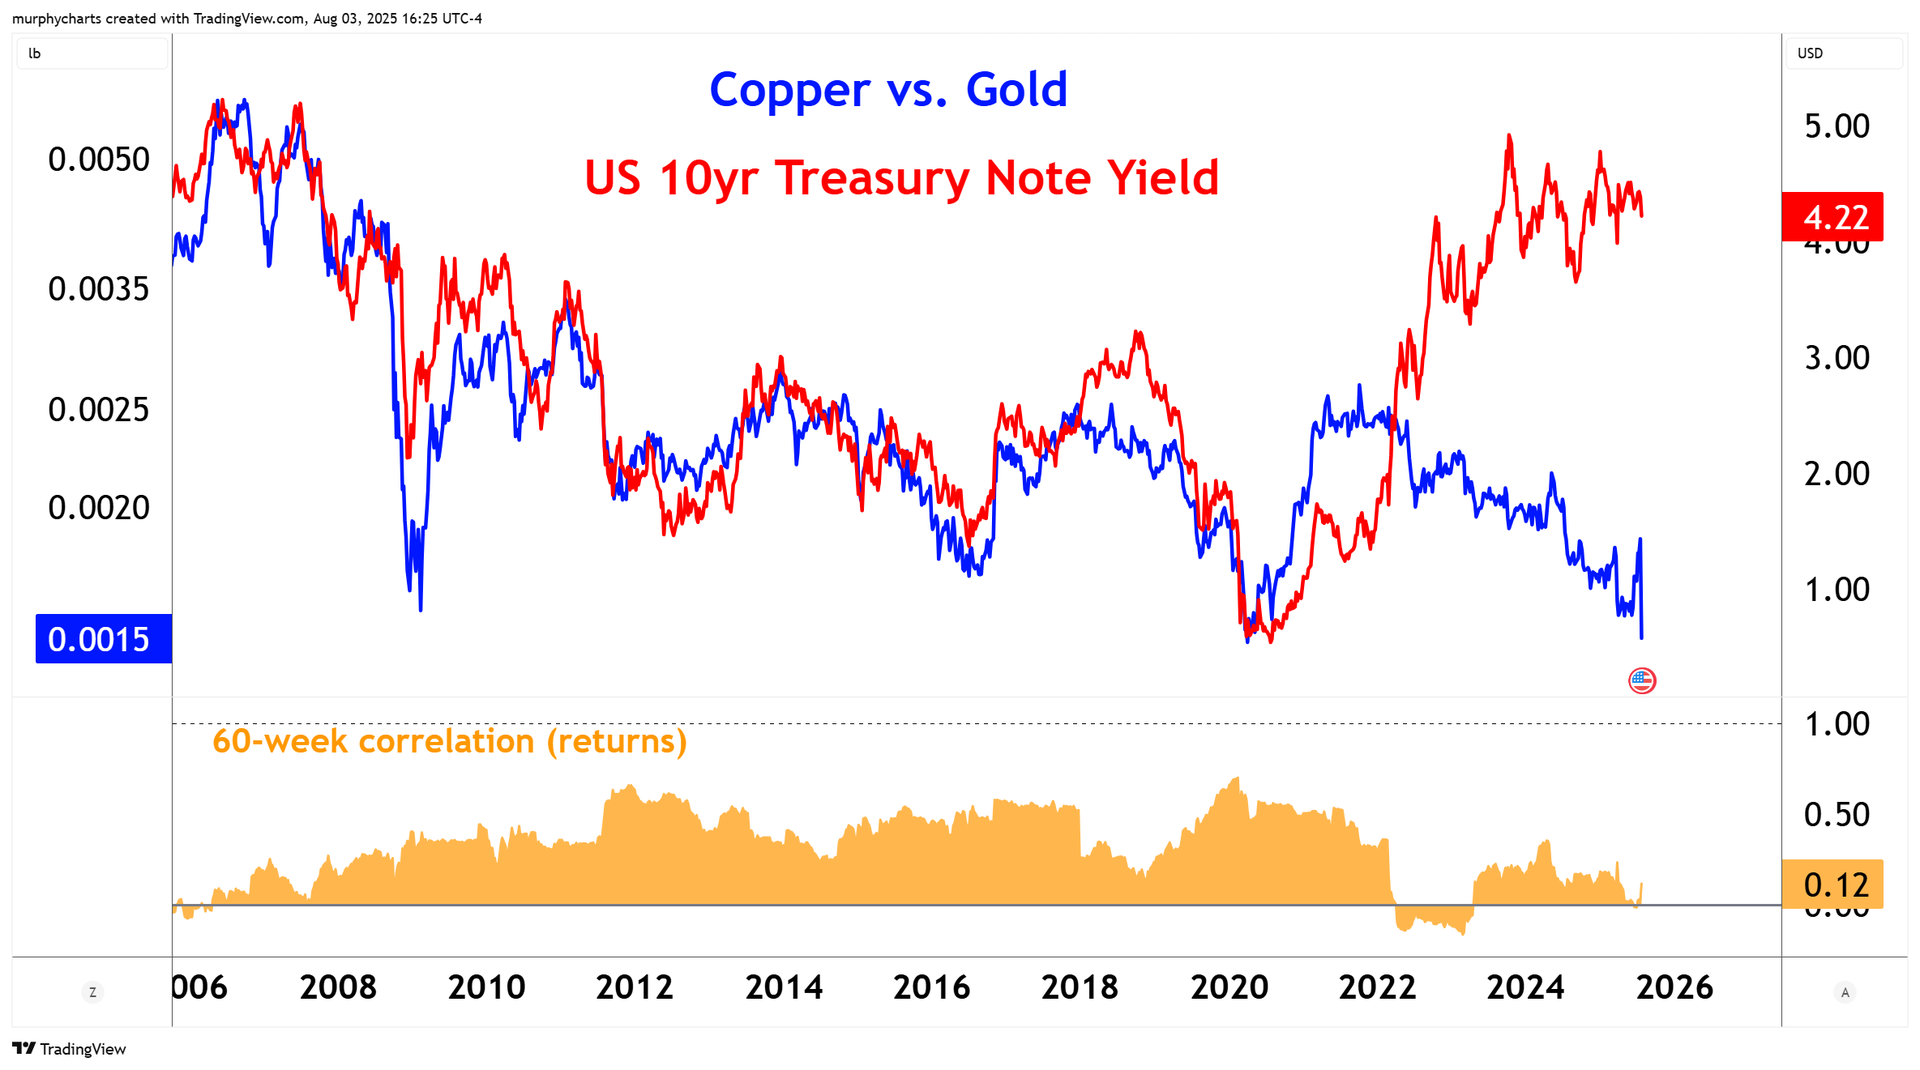
1/ Copper vs. Gold
The Copper/Gold ratio and U.S. 10-year Treasury yield have historically moved in tandem. But since COVID, that relationship has weakened—yields surged on inflation and Fed tightening, while copper lagged on shaky global demand.
Last week saw both copper and yields drop sharply, marking a moment of renewed alignment. It’s unclear if this synchronized decline is suggestive of a dialing back of growth expectations. However, it’s clear the ratio’s reliability hinges heavily on shifting macro drivers like fiscal deficits, central bank purchases of gold, industrial sentiment, and inflation dynamics.
2/ Insurers Experience Rotation
The S&P Insurance Select Industry Index was a standout performer in early 2025, benefiting from its equal-weight structure, strong earnings, and rising premium pricing. Through the end of Q1, the industry was up over 7% year-to-date, strongly outperforming both the broad Financials sector and the S&P 500.
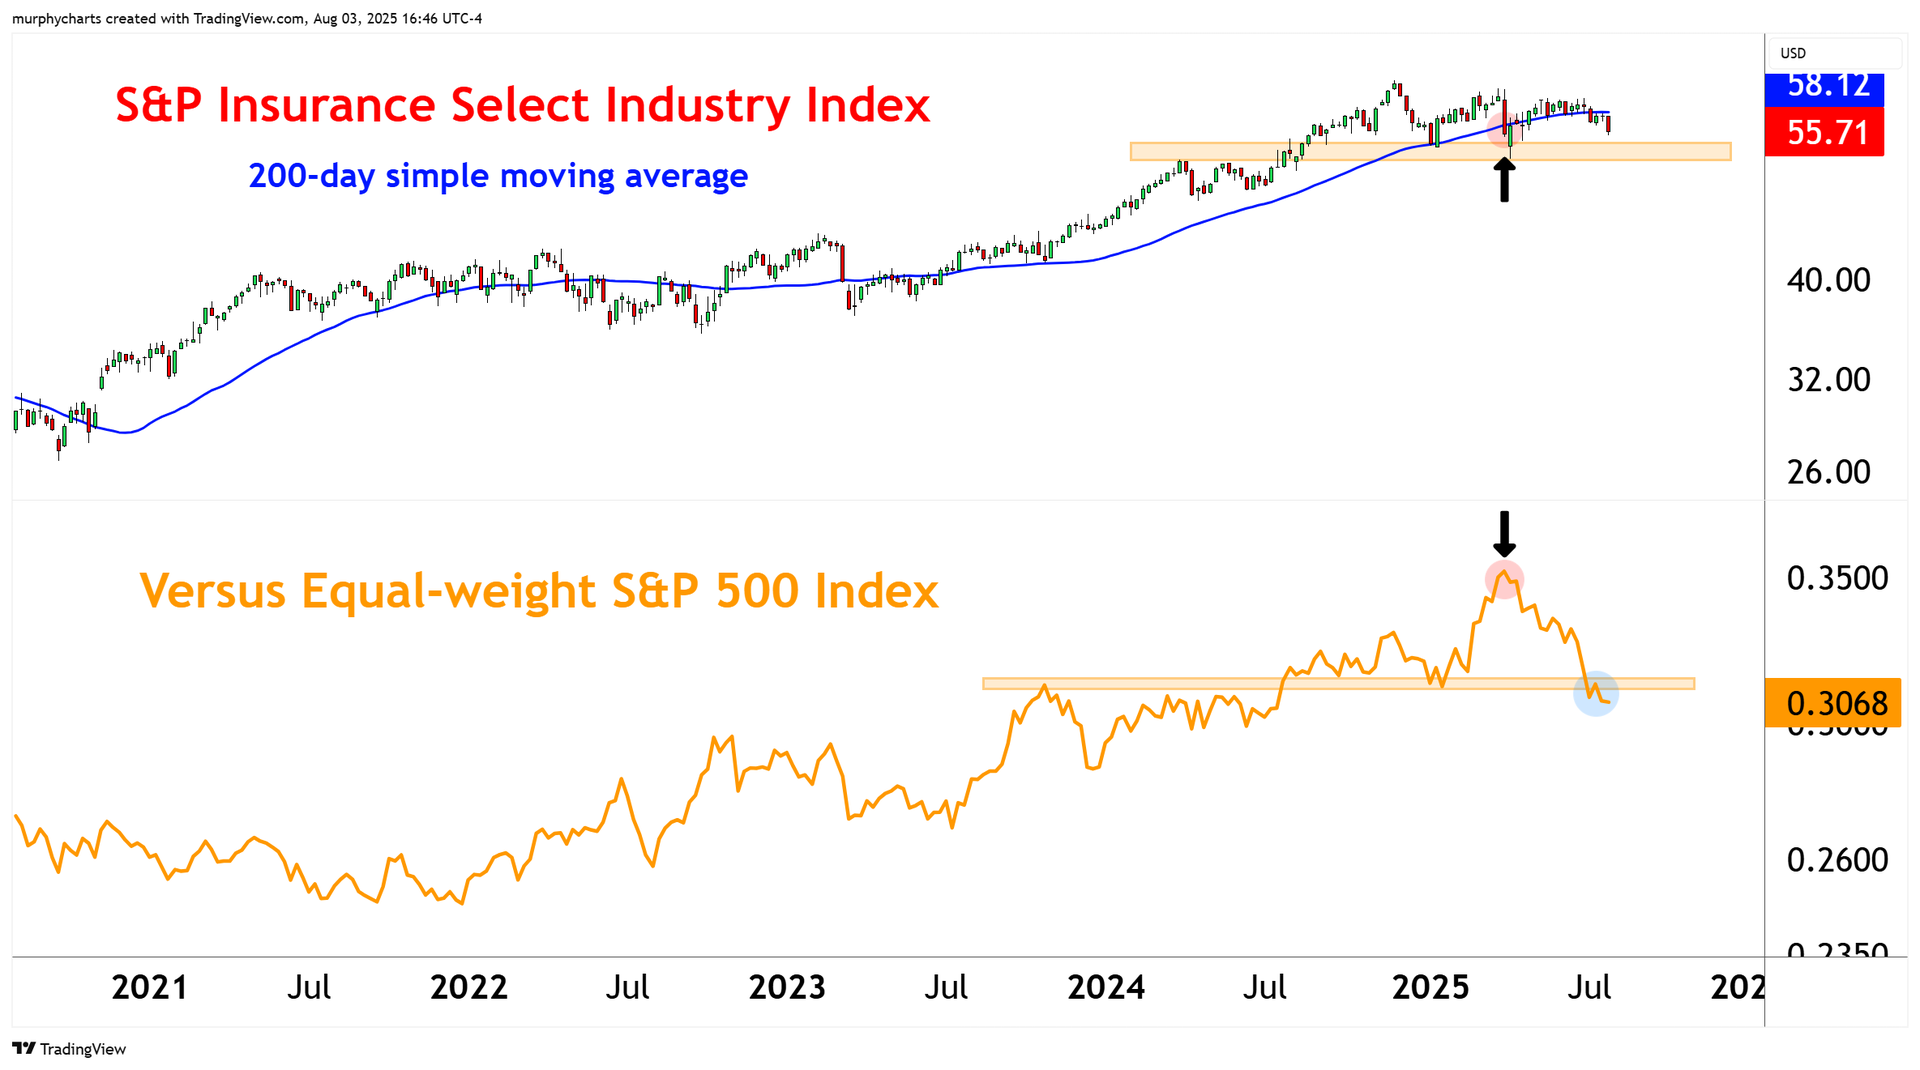
But since April, sentiment has shifted. The industry has given back all its Q1 surge, with returns now negative on the year. Insurers are a cyclically defensive trade – In April we witnessed the beginning of a rotation out of defensives and into more sensitive sectors such as Industrials and Technology. Technology is up over 23% from the end of Q1 – certainly evidence of growing risk appetite!
3/ Gold vs. US Stocks
The ratio of Gold prices versus US Stocks as represented by the S&P 500 Index (SPX), is trading into a confluence zone. Evidenced by multi-year resistance and an upward sloping 200-day simple average.
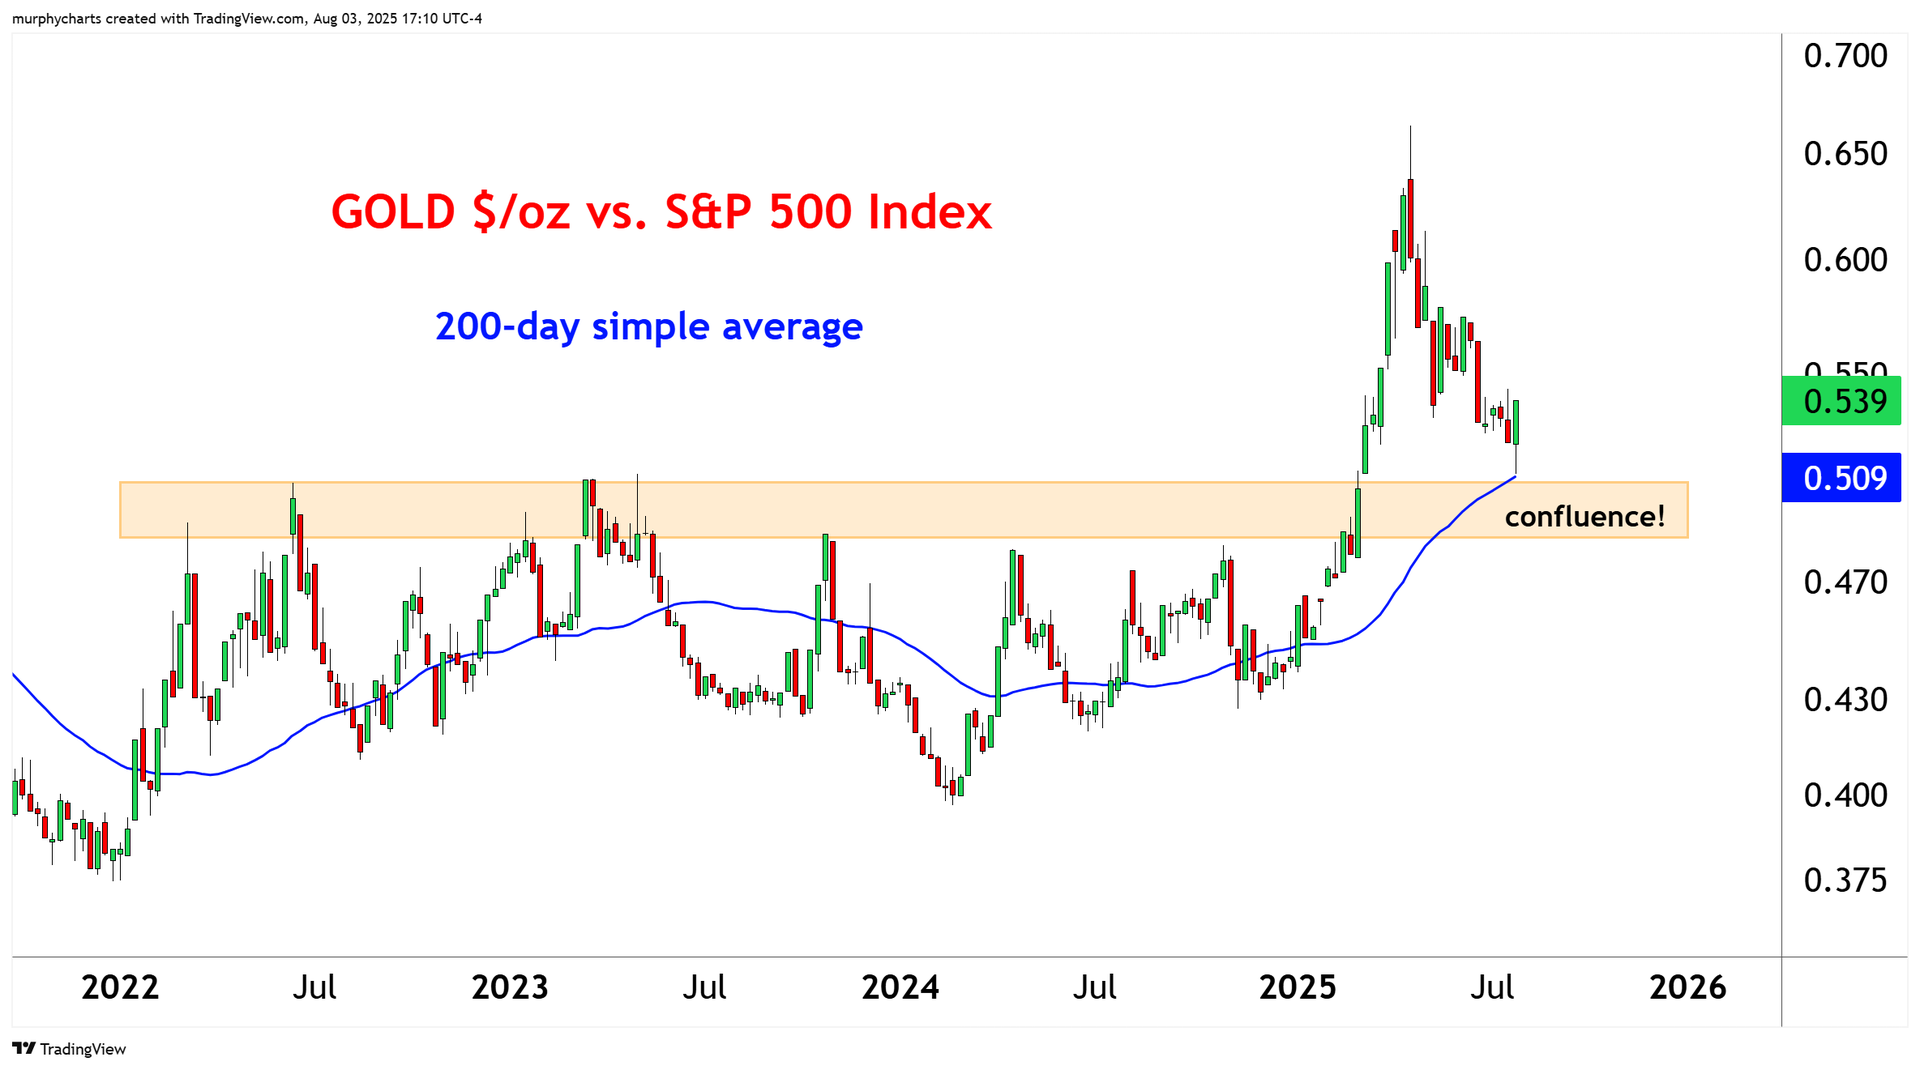
The upward slope of the 200-day average highlights the underlying strength in gold relative to stocks, even after a choppy year. Meanwhile, SPX’s resilience near all-time highs makes this test particularly meaningful: a breakout in the ratio would imply gold is resuming its outperformance over equities, which often coincides with equity risk aversion or macro stress. Traders are watching this ratio closely—it’s nearing an inflection point that could define the narrative into year-end.
Shared content and posted charts are intended to be used for informational and educational purposes only. CMT Association does not offer, and this information shall not be understood or construed as, financial advice or investment recommendations. The information provided is not a substitute for advice from an investment professional. CMT Association does not accept liability for any financial loss or damage our audience may incur.
