1/Small Caps Breaking Through
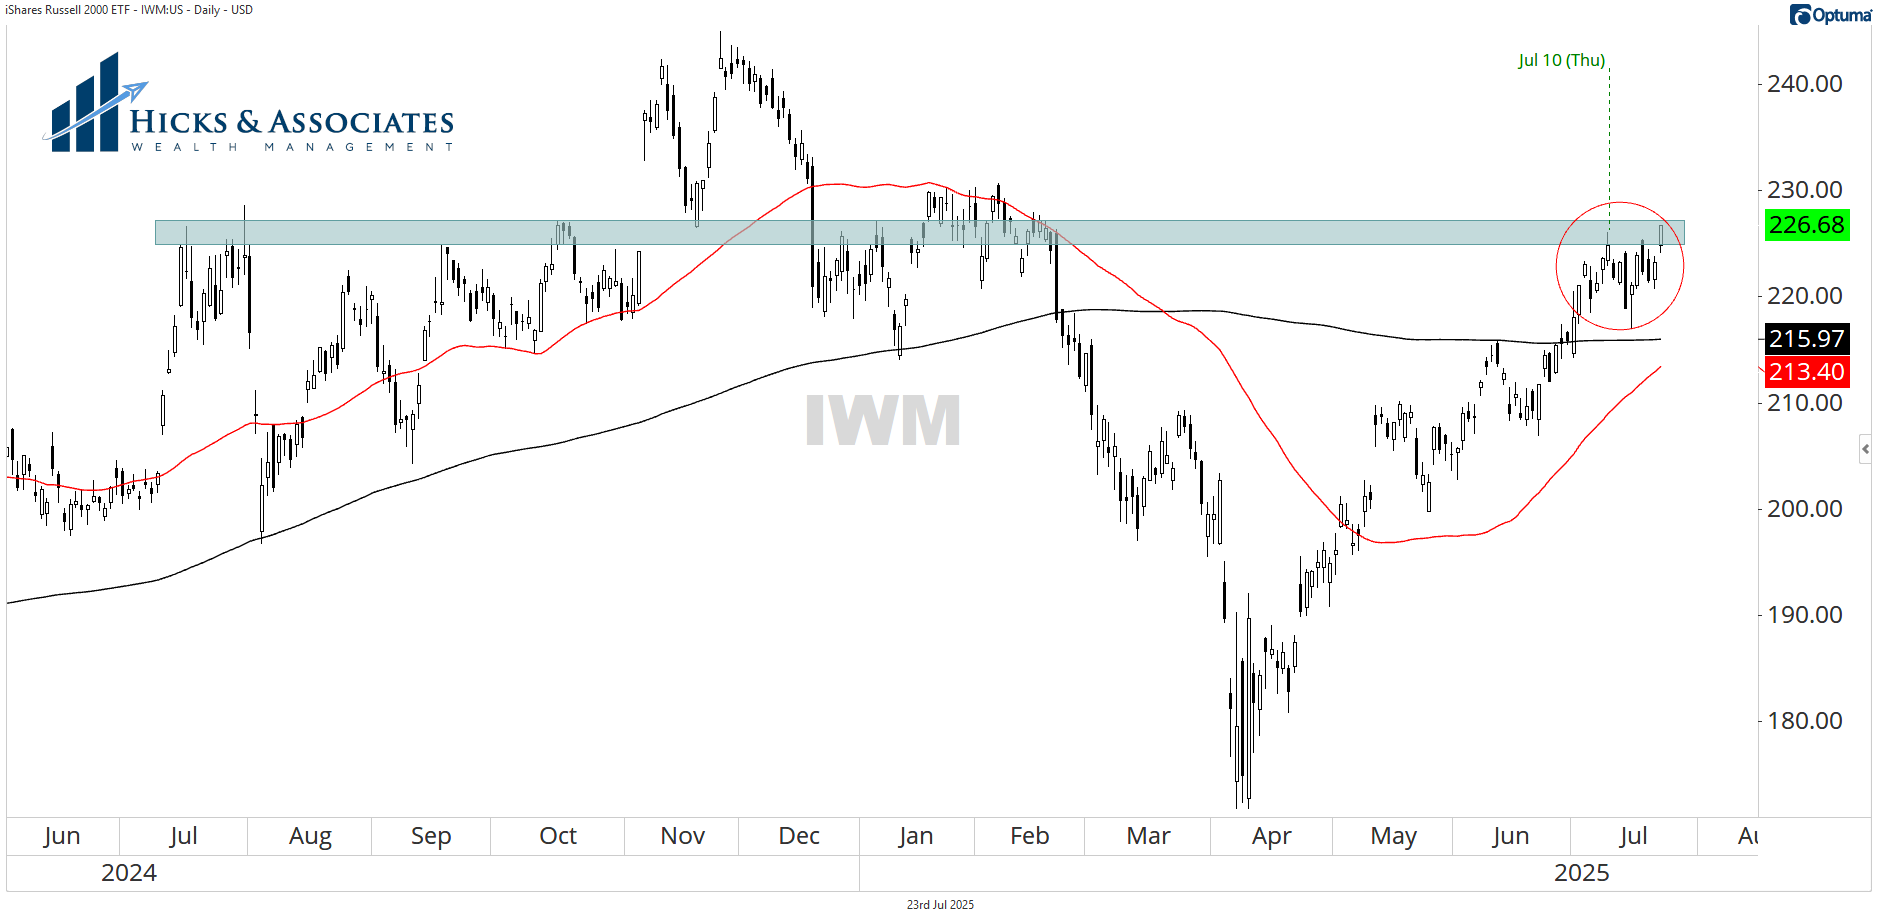
Yesterday, we looked at IWM, the iShares Russell 2000. We said that we need to see IWM break through that blue-gray rectangle. While it has not broken through just yet, Wednesday’s action was a very strong move.
While Wednesday’s price action could be defined as buyable, we generally want to see the 50-day moving average above the 200-day before we buy. However, the question I ask is simply: do you have your buy criteria clearly defined? If not, develop that first.
One more point before moving on. That blue-gray rectangle was drawn and left on my chart for a reason. When I previously examined the chart, I determined I am skeptical of this position until it passes through this area. Wednesday’s price action is admirable, and it is encouraging for the broad market’s ability to keep going. But that doesn’t mean I’m buying it.
2/ International – The Bigger Move
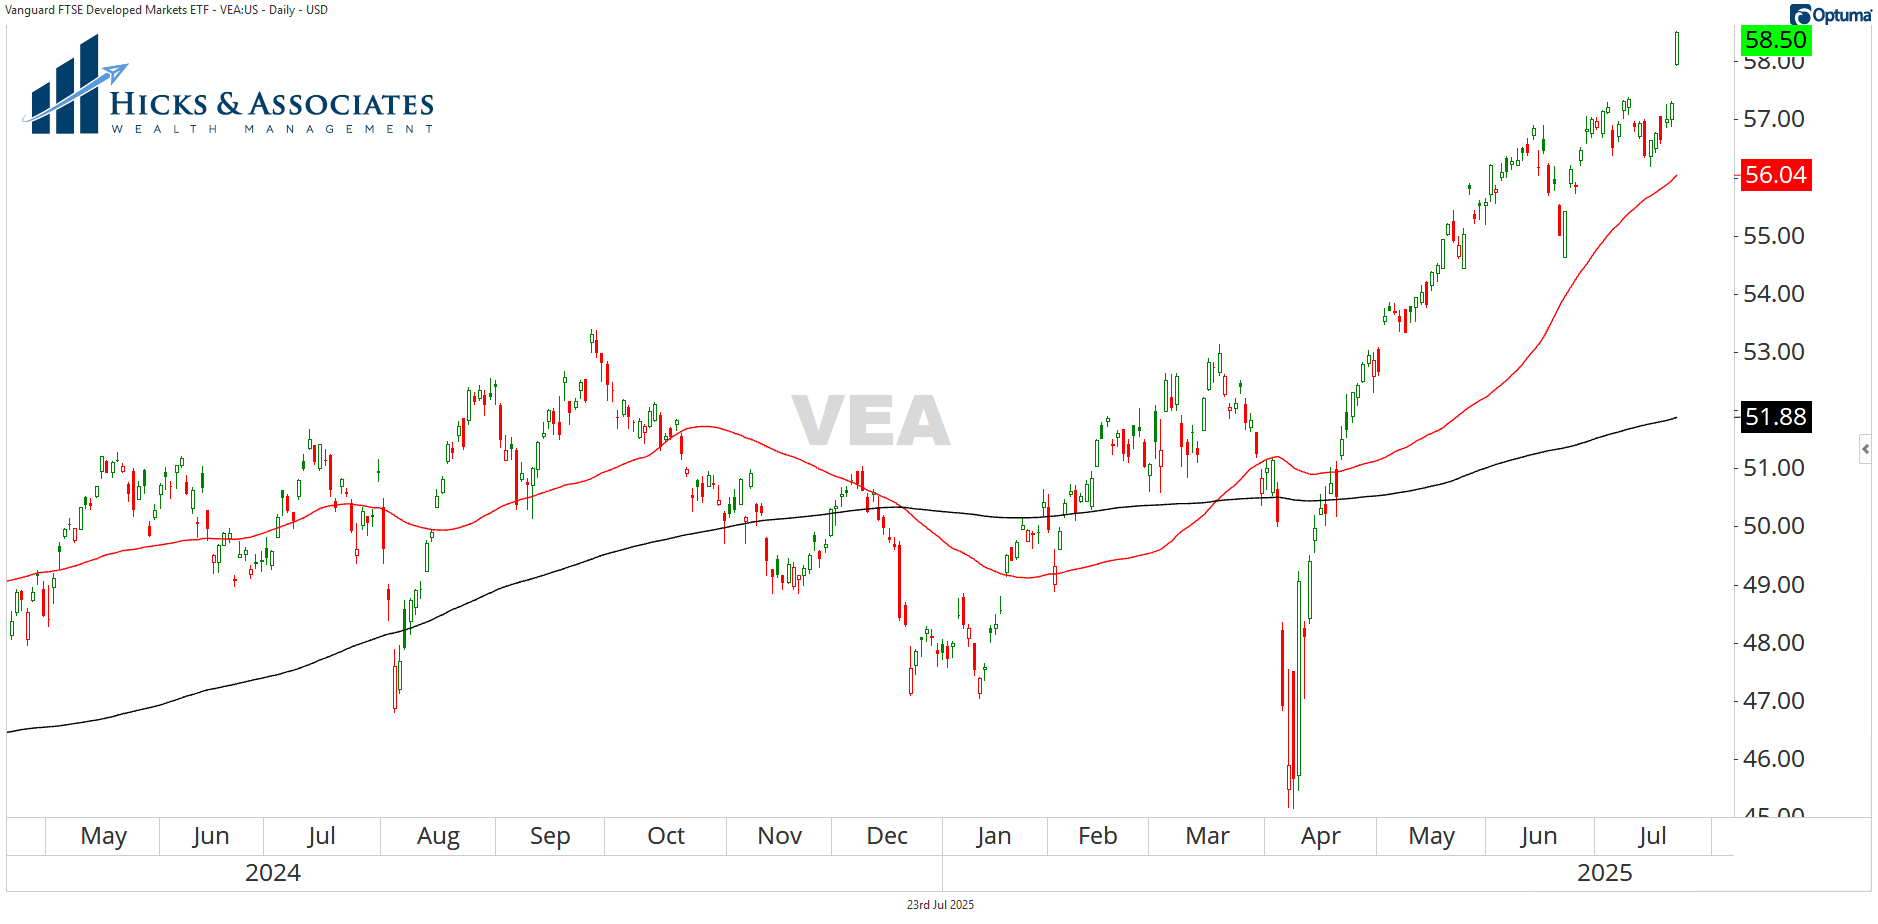
While we like what we see with the small-cap ETF, do not ignore the international space. Chart 2 is VEA, the Vanguard Developed Markets ETF. Yesterday, it rocketed higher on the back of the news of President Trump’s trade deal with Japan. We’ll take a look at that in our third chart.
One of the myths that I try to dispel in my book, Evidence-Based Investing is that you must be diversified. Yes, there are benefits to diversification. But don’t be so diversified that you have diluted your winners. Ordinarily, you will hear financial advisors advocate including international in your portfolio. As for me, I only want it in a client portfolio if it is strong. Well, VEA certainly looks like strength to me.
However, as suggested above, we are not buying anything unless it hits both our trend template and our specific entry criteria. VEA has met the trend template for a while now. But we have not seen the specific entry criteria. Do you have specific criteria?
3/ Not As Much As I’d Like
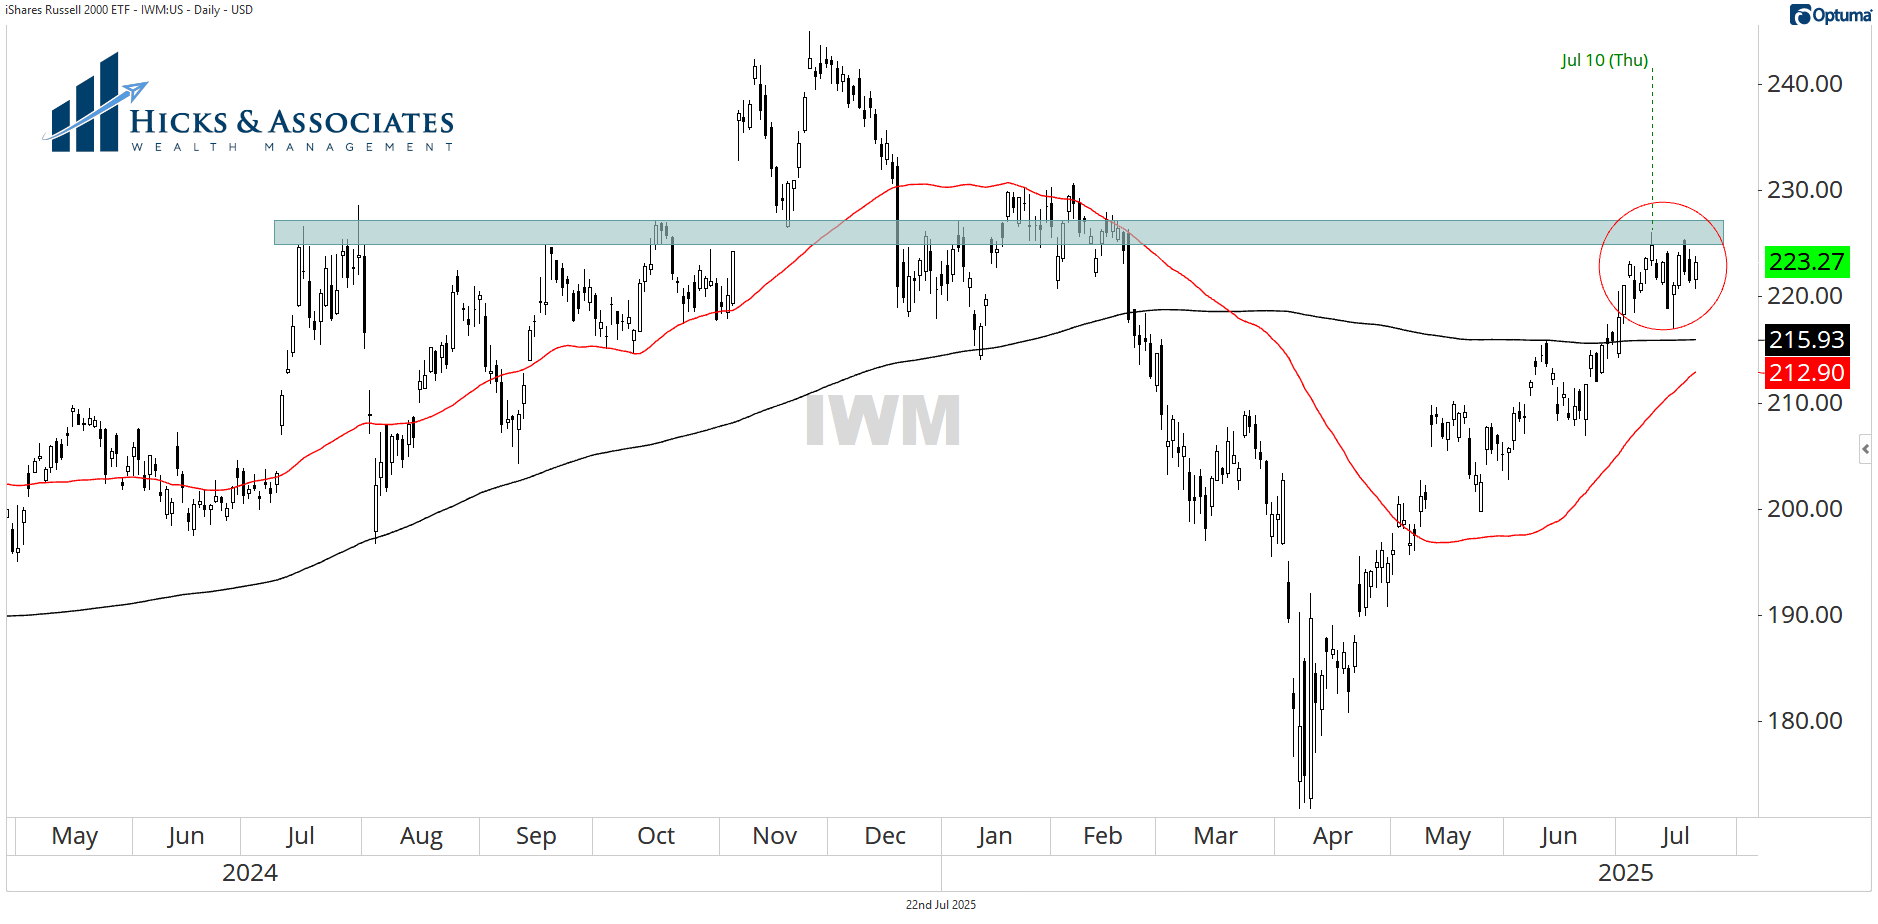
Here we see a problem. Our third chart today is of IWM, the Russell 2000 ETF which is broadly considered the best measure for the small-company universe here in the United States. Here we see that the current area of consolidation does have some more baggage to overcome. These levels are the highs from July 2024. This area has been a really challenging zone for the small company index. While I’m not showing it here, I could zoom out even further and show you that this is about the same level as the highs from 2021.
We should not be surprised if small companies really struggle to truly break free.
4/ Japan – The Biggest Move
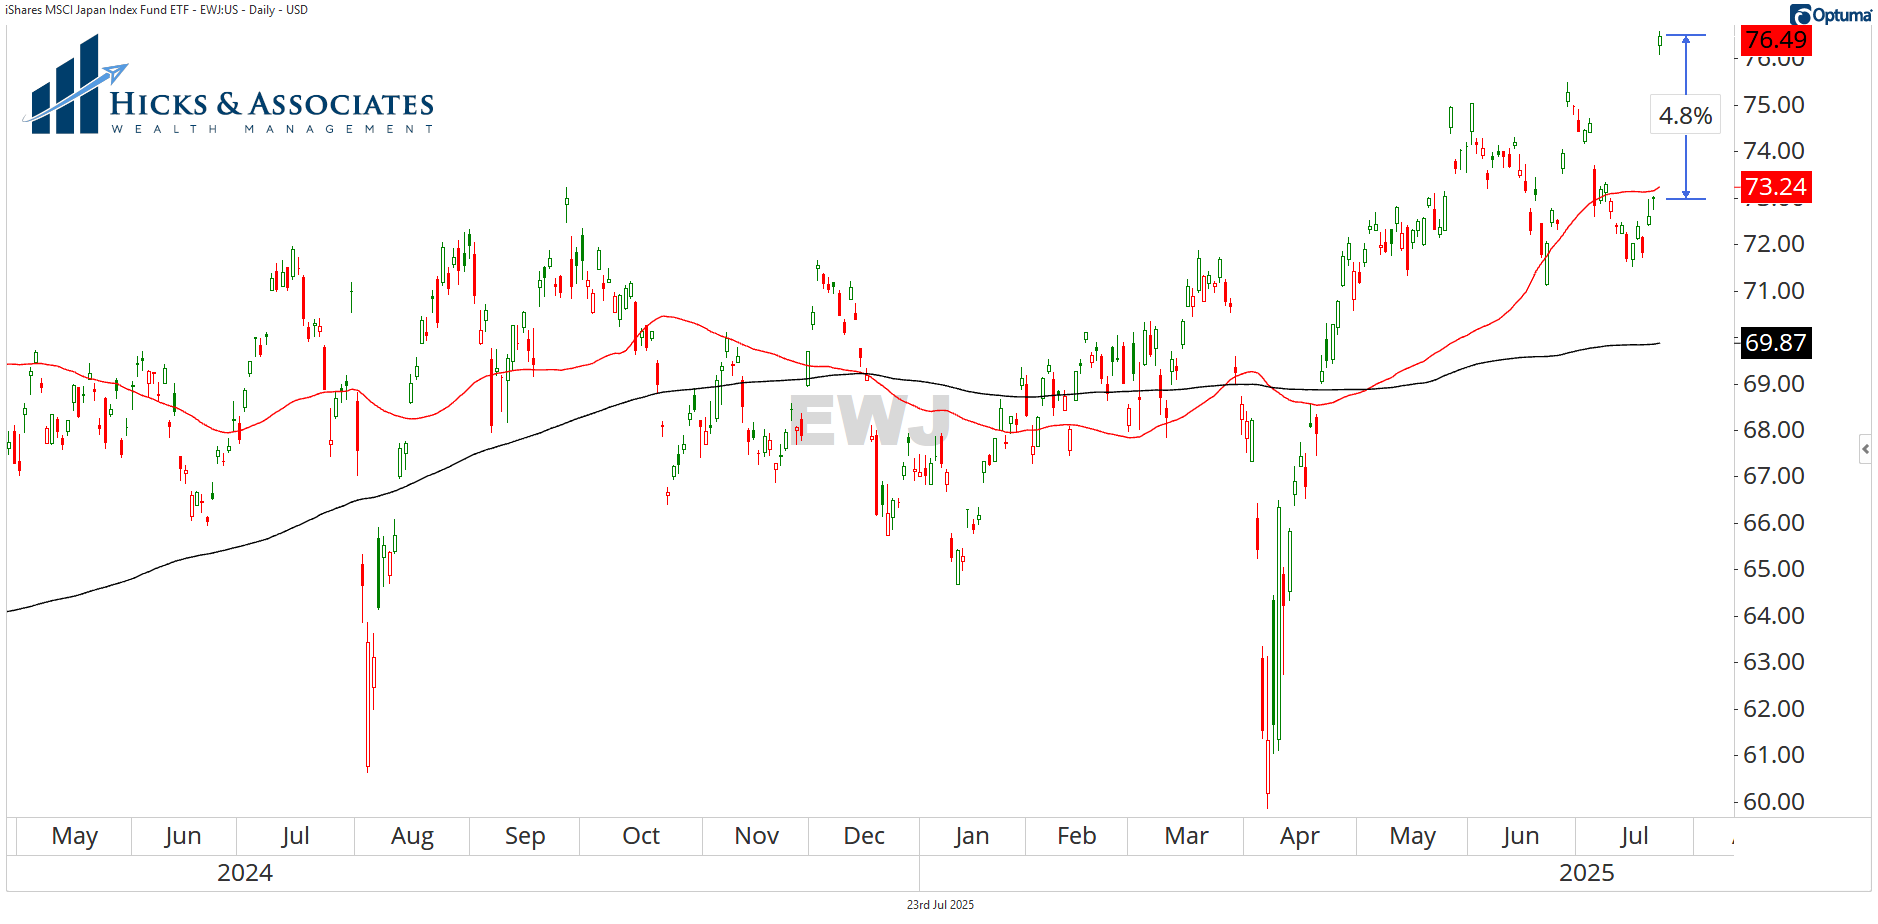
For our third chart, we will take a look at Japan via EWJ the iShares Japan ETF. If your buy criteria is to buy strength, yesterday, this was one of the strongest movers. However, from my perspective, this is a pretty ugly chart.
The big move higher might indeed be sustainable. But I see a lot of erratic behavior. I want to see a battle between the bulls and bears that contracts price. Then, our buy criteria is to buy as the bulls are victorious and move the position higher from that price contraction.
Wednesday’s move in EWJ was an impressive news driven move. Is it sustainable?
5/ Japan = Argentina?
For our final chart for today, let’s look at another single country ETF that also had a massive news driven move.
This is ARGT the Global X Argentina ETF. The red circle just left of center, that’s highlighting election day and the day after the election when President Milei was elected. That was a massive gap higher at the open the next day. Could you have bought that? Sure. But we would not. We are not going to chase anything. Prior to that move, the ETF was breaking down.
But, once that election driven gap higher happened, it’s now on our radar. Now we begin looking to see: will it be a sustained move? Or was it a flash in the pan? We did trade ARGT a couple of times but for reasons I explain in my book, we are rarely holding something for a long term. (Ultimately, I just do not believe most of you are actually long-term investors. Perhaps I’ll elaborate on why in tomorrow’s newsletter.)
Shortly after that election, we see ARGT begin to move sideways. As it began to move out of that area, that’s what we would consider a good entry point.
If you are enjoying this week’s newsletter, be sure to connect with me on LinkedIn or follow me on Twitter.
Shared content and posted charts are intended to be used for informational and educational purposes only. CMT Association does not offer, and this information shall not be understood or construed as, financial advice or investment recommendations. The information provided is not a substitute for advice from an investment professional. CMT Association does not accept liability for any financial loss or damage our audience may incur.
