Investopedia is partnering with CMT Association on this newsletter. The contents of this newsletter are for informational and educational purposes only, however, and do not constitute investing advice. The guest authors, which may sell research to investors, and may trade or hold positions in securities mentioned herein do not represent the views of CMT Association or Investopedia. Please consult a financial advisor for investment recommendations and services
LME Copper: Naughty or Nice?
This week, I am doing my best impression of Santa Claus by reviewing various energy, metals, and perhaps a few equity charts to decide if they will be put on the naughty or nice list. I am sure that Jolly Old Saint Nicholas has his elves put all children on the nice list, at least initially. Therefore, we will do the same for the markets we review. However, should those markets display some bad behavior, then we will all know when to move them to the naughty list as their trends weaken or change.
Over the last few days, I have reviewed my list of primarily U.S.-based commodity markets. Although most of these commodities have global implications, today I will take a trip across the pond and analyze the LME Copper 3-Month Contract to see if it has been naughty or nice.
LME Copper Overview
After dropping to $8105 in early April 2025, copper has formed a ‘nice’ uptrend. The uptrend remains firmly intact, and prices are positioned to test important wave projections at $12055 and $12253. Settling above these targets, most specifically, $12253, should be a challenge given their confluence and importance within the broader wave structure dating back to July 2022. Closing above $11910 will negate a few ‘naughty’ bearish factors that formed during the pullback from $11952, opening the way for the test of $12055 and $12253. Such a move would keep copper on the nice list for this holiday season.

https://www.kaseco.com/wp-content/uploads/2025/12/Copper-Table-scaled.jpg
Nevertheless, the pullback from $11952 confirmed a daily RSI overbought signal, a daily bearish KasePO divergence, and formed a weekly shooting star. The weekly KasePO, RSI, and Stochastic are also overbought. These ‘naughty’ factors warn that a deeper test of support might occur before copper reaches $12055 and $12253. While $11910 holds, there is a reasonable chance for a test of $11408. Closing below this will call for a test of the naughty list threshold at $11111.
Realistically, settling the week below $11111 will not definitively break the uptrend. That will require a close below $10491. However, settling below $11111 will confirm the weekly shooting star and take out wave projections and retracement levels that indicate a bearish reversal might be underway. Therefore, I am going to hold copper to a high standard of remaining ‘nice’ and put it on the ‘naughty list’ should prices close below $11111 for a few days.
Below are some of the recent technical factors used to determine the ‘naughty’ or ‘nice’ outlook for the next few weeks.
Nice (Bullish)
- Settled above the:
- Equal to (1.00) target of the wave up from $9553.5
- Intermediate (1.382) target of the wave up from $10326
- XC (2.764) projection of the wave up from $10577.5
- Held the 38 percent retracement of the rise from $10577.5
- Fulfilled the smaller than (0.618) target of the wave up from $11451.5
- All major prior swing lows have held
- Trading above all major daily moving averages, which are in a rising bullish stack
- Daily Kase Trend is weak bullish
- 10-day DMI is bullish, ADX is above 40 and rising (uptrend)
Naughty (Bearish)
- Weekly shooting star
- Weekly KasePO, RSI, and Stochastic are overbought
- Daily RSI overbought signal
- Daily KasePO divergence
- Met the smaller than (0.618) target of the wave down from $11952
LME Copper Weekly Chart
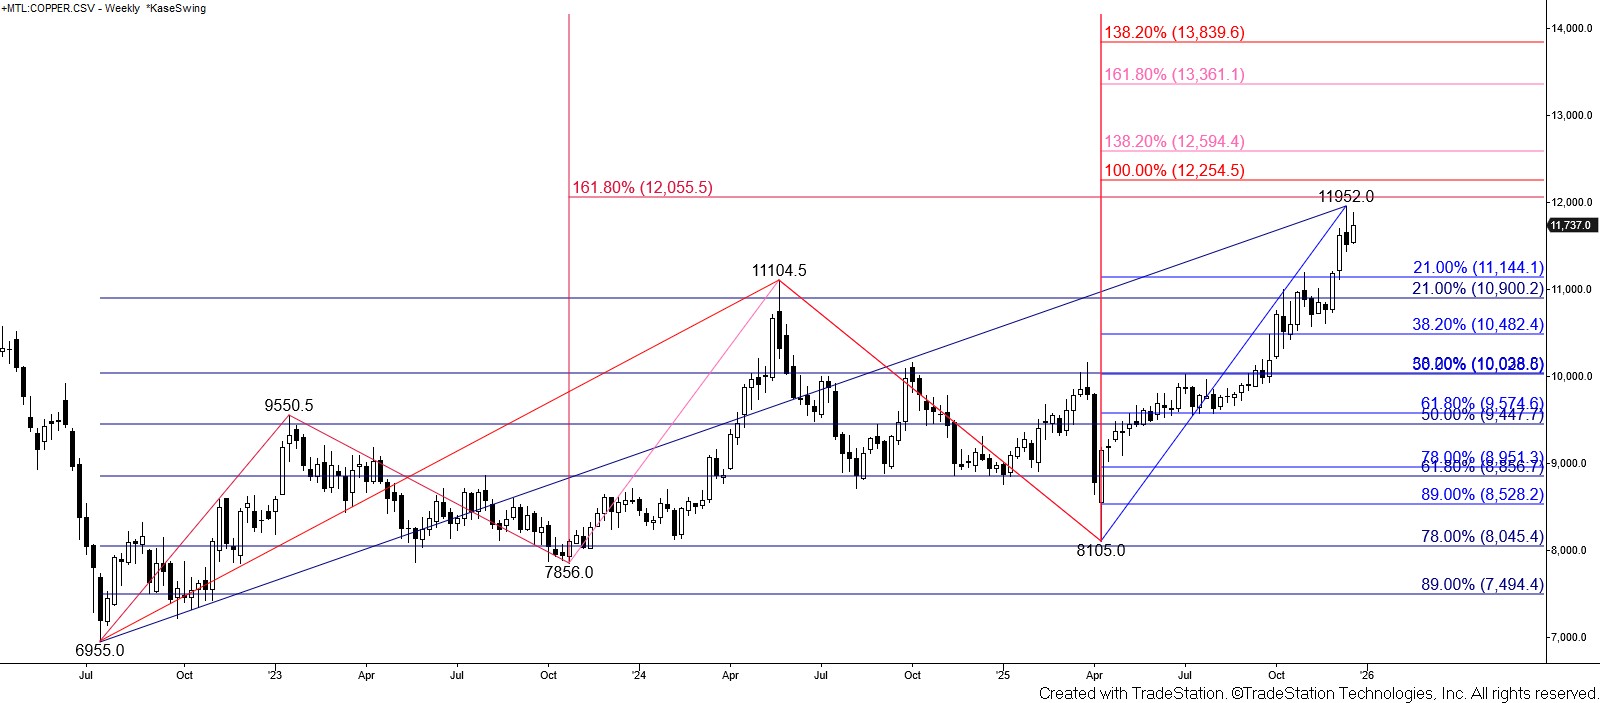
Copper’s uptrend remains firmly intact. All major prior swing lows have held, prices are trading above all major daily moving averages—which are rising in a bullish stack—and the daily trend indicators are bullish. The waves up from $6955 call for a continued rise to challenge at least $12055 and likely $12253. These are the larger than (1.618) target of the first wave up from $6955 (crimson) and the equal to (1.00) target of the primary wave up from $6955 (red). Both are probable stalling points, most specifically $12253, because this is a projection of a long-term primary wave. A sustained close above $12253 will reflect longer-term bullish sentiment, keeping copper on the ‘nice list’ into the new year and possibly for another few months.

https://www.kaseco.com/wp-content/uploads/2025/12/Copper-Weekly.jpg
LME Copper Daily Chart
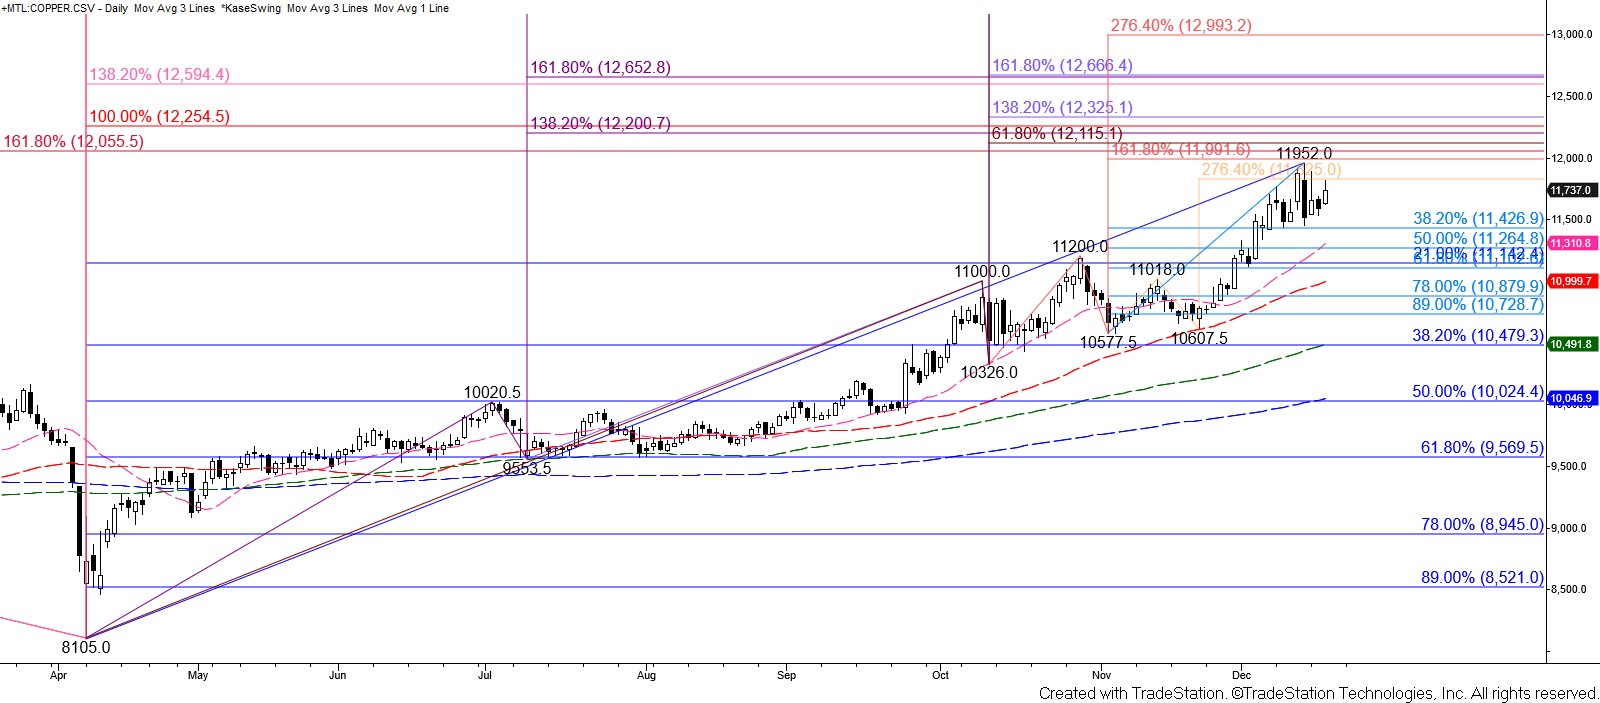
The 38 percent retracement of the rise from $10577.5 (light blue) held. This implies that the pullback from $11952 is a simple correction and that copper will remain on the ‘nice list’. Furthermore, the intraday wave up from $11451.5 challenged its $11808 smaller than (0.618) target on Wednesday. This target held on a closing basis, but meeting $11808 suggests that this wave will extend to its equal to (1.00) target, which is in line with the $11910 corrective swing high of the wave down from $11952. Settling above $11910 will indicate that the correction is complete, clearing the way for $12055 and $12253.

https://www.kaseco.com/wp-content/uploads/2025/12/Copper-Daily.jpg
Nevertheless, the wave down from $11952 fulfilled its $11581 smaller than (0.618) target on Tuesday. Therefore, while $11910 holds, this wave still has a modest chance of reaching its $11408 equal to target before the move up extends to a new high. Settling below $11408 would take out the equal to target and the 38 percent retracement of the rise from $10577.5 (light blue). This ‘naughty’ behavior would lead to a test of the ‘naughty list’ threshold at $11111.
The $11111 level is the ‘naughty list’ threshold for the coming weeks because it is in line with the larger than (1.618) target of the intraday wave down from $11952, the 21 percent retracement of the rise from $8105 (blue), the 62 percent retracement from $10577.5 (light blue), and the confirmation point of the weekly shooting star. Settling below $11111 for a few days would suggest that a bearish reversal is underway, and at minimum, a much more significant test of support will unfold in the coming weeks.
Should copper close below $11111, which is doubtful before prices rise to $12055 and $12253, look for the next support thresholds at $10934 and $10491. The $10934 level is the lowest that the intraday wave down from $11952 projects and sits between the 50-day moving average and the 78 percent retracement from $10577.5 (light blue). It is also in line with the 21 percent retracement of the rise from $6955 (dark blue). To confirm that the uptrend has been broken and that a bearish reversal is underway, copper must close below $10491. This is the 38 percent retracement of the rise from $8105 (blue), the 100-day moving average, and sits below the last major swing low at $10577.5.

Dean Rogers, CMT, has been a member of the CMT Association for 17 years. He has over 25 years of experience as a technical analyst specializing in trading indicators and systems development, writing award-winning forecasts for the energy and metals commodity markets, and creating hedging and risk management strategies. Dean is the President of Kase and Company, Inc.

Shared content and posted charts are intended to be used for informational and educational purposes only. CMT Association does not offer, and this information shall not be understood or construed as, financial advice or investment recommendations. The information provided is not a substitute for advice from an investment professional. CMT Association does not accept liability for any financial loss or damage our audience may incur.
