1/ Market Trend Model Affirms Bullish Trend
Our Market Trend Model uses weekly S&P 500 index data to generate trend signals for three different time frames. After turning bullish on all three time frames at the beginning of May, the model has confirmed the primary uptrend for our main equity benchmark.
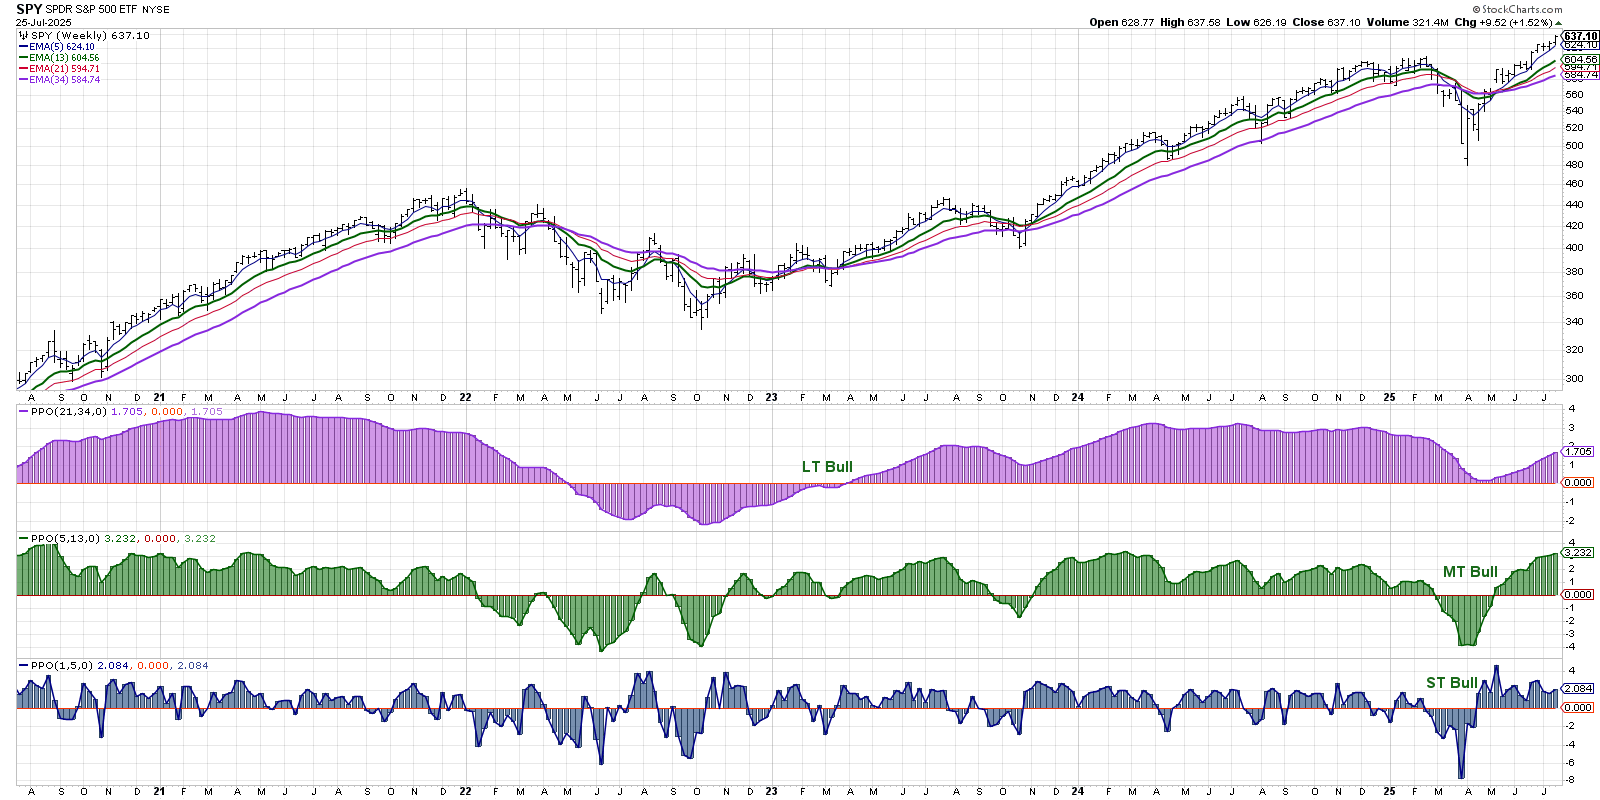
While the long-term model has been bullish since April 2023, the medium-term and long-term models both turned negative soon after the February 2025 peak. The short-term model turned back bullish a couple weeks after the April 2025 market low, although the medium-term model took a few more weeks before finally turning bullish the first week in May.
With the Market Trend Model in its current “all bullish” configuration, we’re simply looking for a negative reversal in the short-term model. This would suggest a tactical pullback within a cyclical uptrend. If the medium-term model would also turn negative, that would indicate a more significant corrective move for stocks. Such a signal would definitely cause me to rotate to more defensive positions.
2/ S&P 500: Separating Signal from Noise
The daily chart of the S&P 500 shows how last week’s strength served to negate a concerning bearish momentum divergence that had been emerging on a number of equity charts in July.
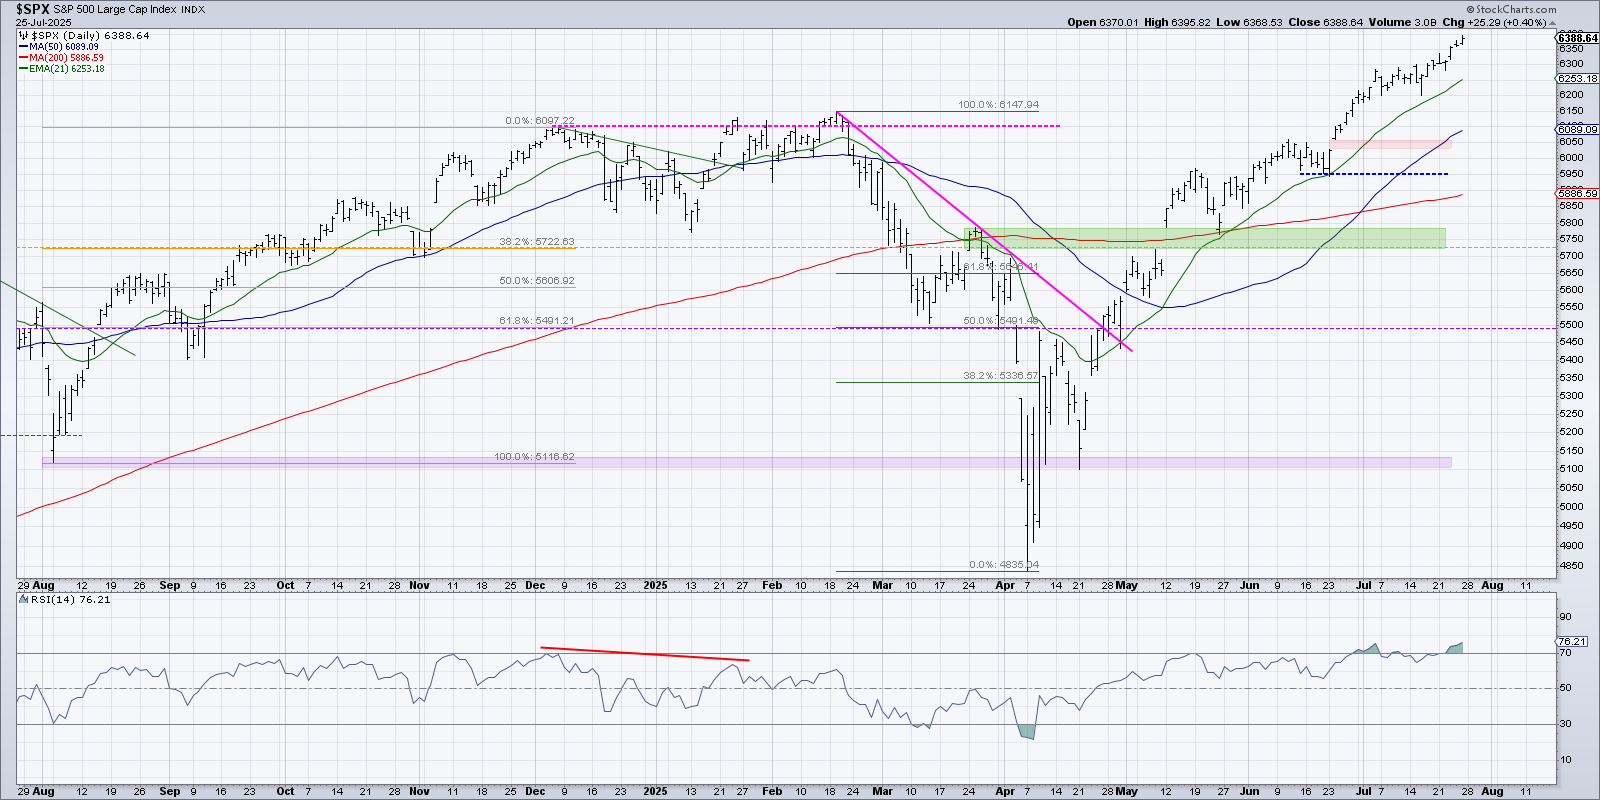
When the S&P 500 pushed above 6200 for the first time in early July, the RSI pushed up to around the 75 level. When the S&P touched 6300 for the first time a few weeks later, the RSI was closer to 70. But with last week’s strong rally with exceptional upside momentum, the RSI pushed back above the overbought level. Higher highs on stronger momentum are bullish!
Despite the strong trend and momentum characteristics, a pullback should be expected during any uptrend phase. The 21-day exponential moving average often serves as an initial level of support during a retracement, as we observed in both May and June. We’d be watching the 21-day exponential moving average closely on any pullback, as well as the hammer candle from mid-July with a low around 6200.
3/ New Dow Theory Flashes “Bull Confirmed” Signal
Charles Dow’s foundational work from the early 20th century elucidated the benefits of tracking two major indexes to gauge the strength of the US economy. While Dow himself used the Dow Industrials and Dow Railroads, we’ve come to favor a more modernized version of what is known as Dow Theory.
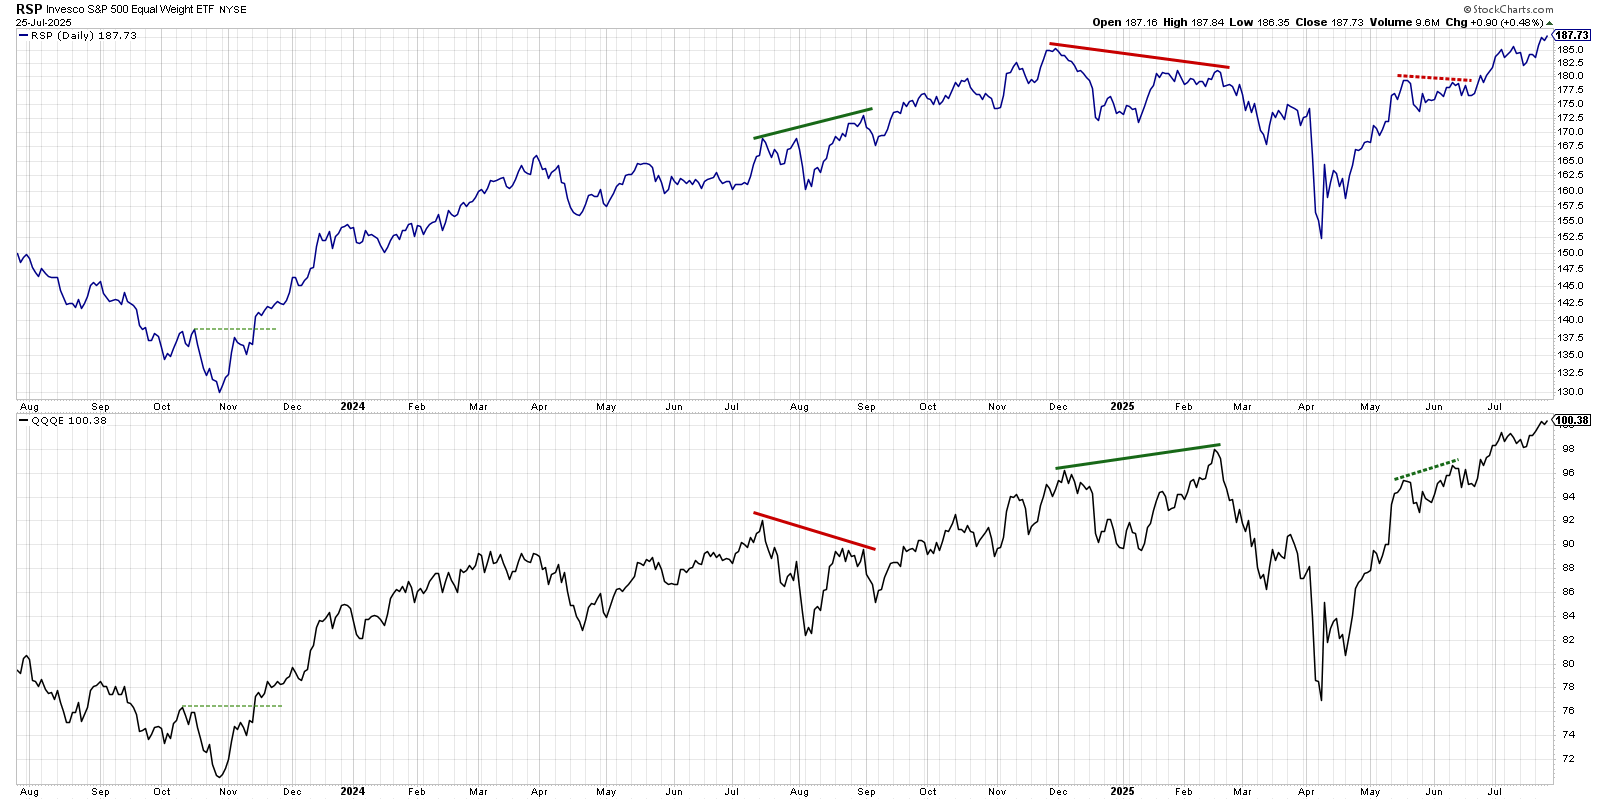
Here we’re showing the equal-weighted S&P 500 and equal-weighted Nasdaq 100 ETFs. If both ETFs are making new highs, we have a “bull confirmed” signal and a strong stock market. If one ETF would make a new high and the other would not confirm the breakout, that would represent a “bearish non-confirmation” and indicate a high likelihood for failure.
A classic bearish non-confirmation signal flashed at the February 2025 market peak, followed soon by the selloff into the eventual April low. We noticed a similar bearish non-confirmation in June, when the equal-weighted Nasdaq 100 broke out but the S&P 500 did not confirm. But with the strength in late June into July, both ETFs have now broken out to new all-time highs. According to Dow Theory, this suggests a bull market until proven otherwise.
Shared content and posted charts are intended to be used for informational and educational purposes only. CMT Association does not offer, and this information shall not be understood or construed as, financial advice or investment recommendations. The information provided is not a substitute for advice from an investment professional. CMT Association does not accept liability for any financial loss or damage our audience may incur.
