Investopedia is partnering with CMT Association on this newsletter. The contents of this newsletter are for informational and educational purposes only, however, and do not constitute investing advice. The guest authors, which may sell research to investors, and may trade or hold positions in securities mentioned herein do not represent the views of CMT Association or Investopedia. Please consult a financial advisor for investment recommendations and services
Mastering Top-Down Relative Strength: A Systematic Approach to Stock Selection
In this guide, I will outline my core methodology for top-down stock selection. The philosophy is straightforward: we identify the strongest stocks within the strongest sectors. By aligning our trades with institutional momentum, we significantly increase our probability of success.
While tools like Relative Rotation Graphs (RRG) are excellent for this analysis, you don’t need expensive software to execute this strategy. Below, I will demonstrate how to perform Relative Strength (RS) analysis using the free version of TradingView.
Note: All analysis in this example uses data with a 90-day lag to comply with SEBI requirements.
Step 1: Utilizing the ‘Compare Symbol’ Feature
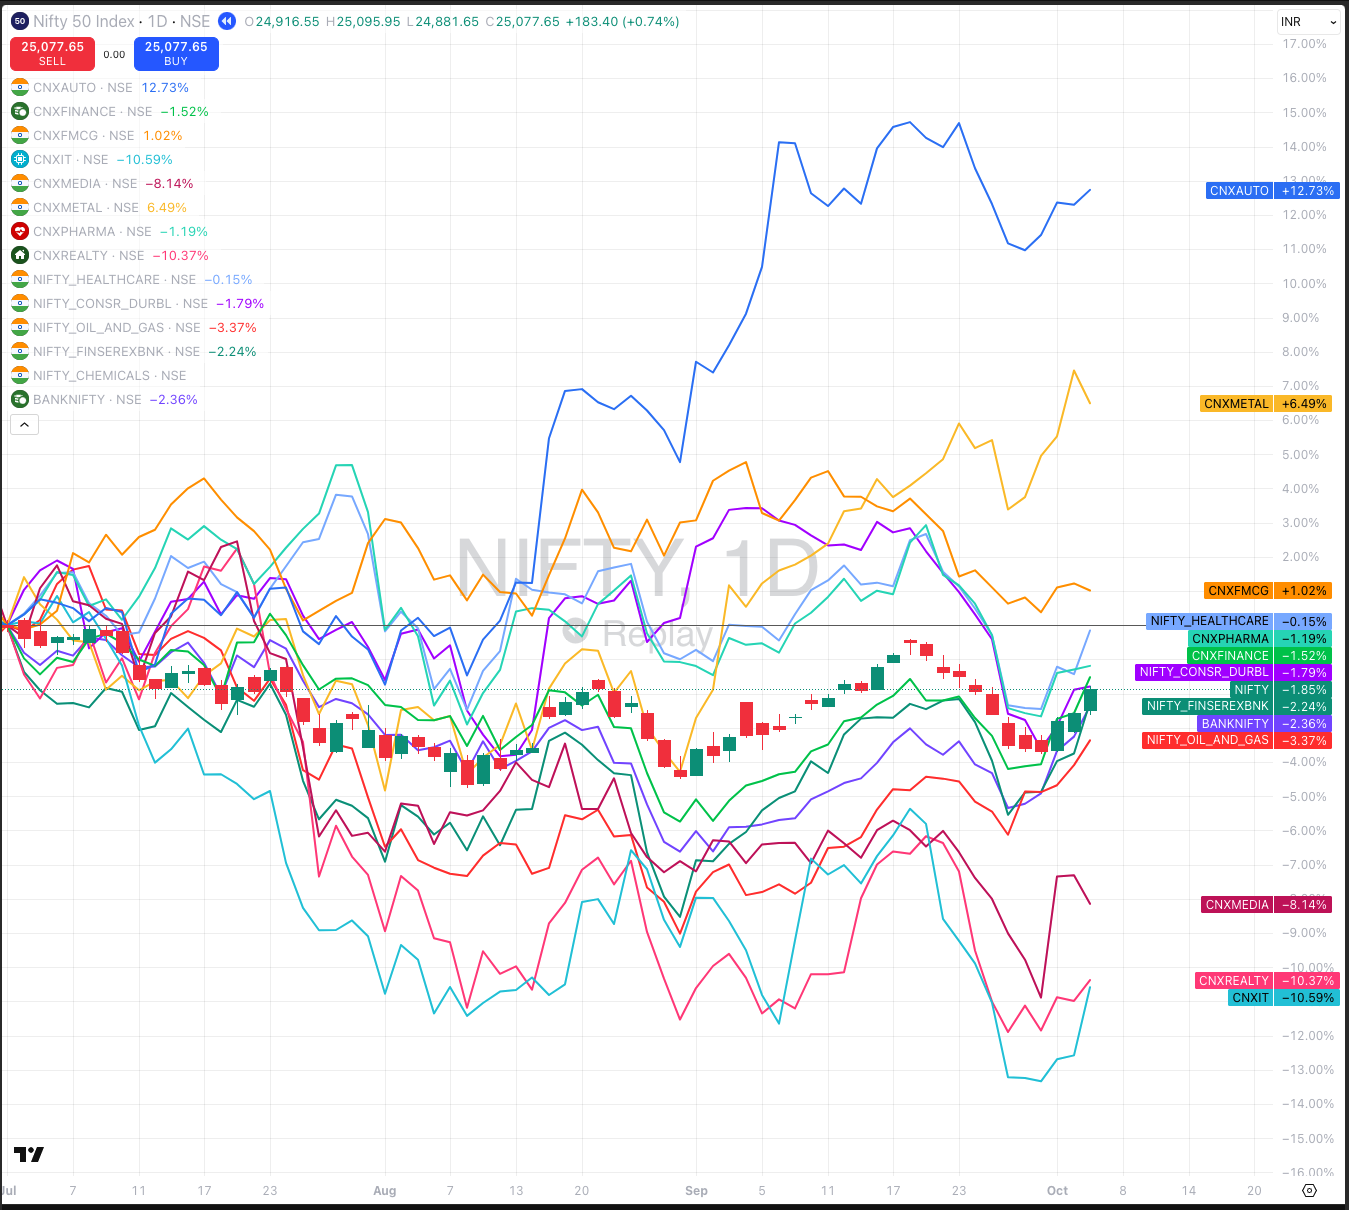
To begin, we need a baseline. In the Indian market, we use the Nifty 50 as our primary benchmark.
Open the Nifty chart in TradingView.

Click the ‘+’ (Compare) icon in the top-left corner of Trading view.
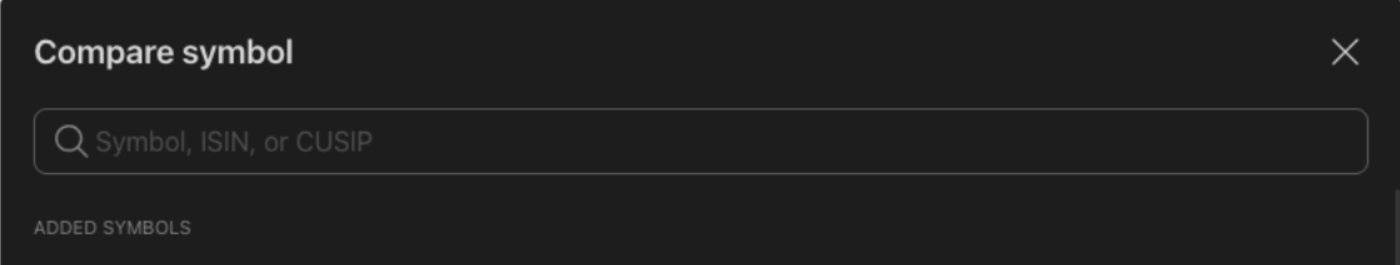
In the “Compare Symbol” search box, type the sectoral indices you wish to track (e.g., Nifty Auto, Nifty IT, Nifty Metal).
Once added, these indices will appear as line charts overlaid on the Nifty chart.
Understanding the Visuals: The Y-axis on the right will convert to a percentage (%). TradingView anchors the left-most point of your visible screen to 0%. Everything to the right of that point represents the cumulative percentage change relative to that start date.
Example: The following chart compares Nifty against various sectoral indexes – Auto, Finance, FMCG, IT, Media, Metal, Pharma, Realty, Healthcare, Consumer Durables, Oil and Gas, Financial Services ex-bank, Chemicals, Bank Nifty.
Step 2: Identify Outperforming Sectors
The goal here is to filter out the noise and find sectors displaying “Relative Strength”—those moving higher or falling less than the Nifty.
Set Your Interval: Use the Daily Chart for reliable sector and stock selection.
Define Your Timeframe: I typically look at a 90-day window. Alternatively, you can anchor your start date to a major market low or a significant swing point.
Analyze the Spread: Align your start date with the left side of your screen. TradingView will automatically recalculate the percentage moves.
Case Study Example: During the first week of October, our analysis showed that Auto, Metals, FMCG, Healthcare, Pharma, Finance, and Consumer Durables were all significantly outperforming the Nifty.
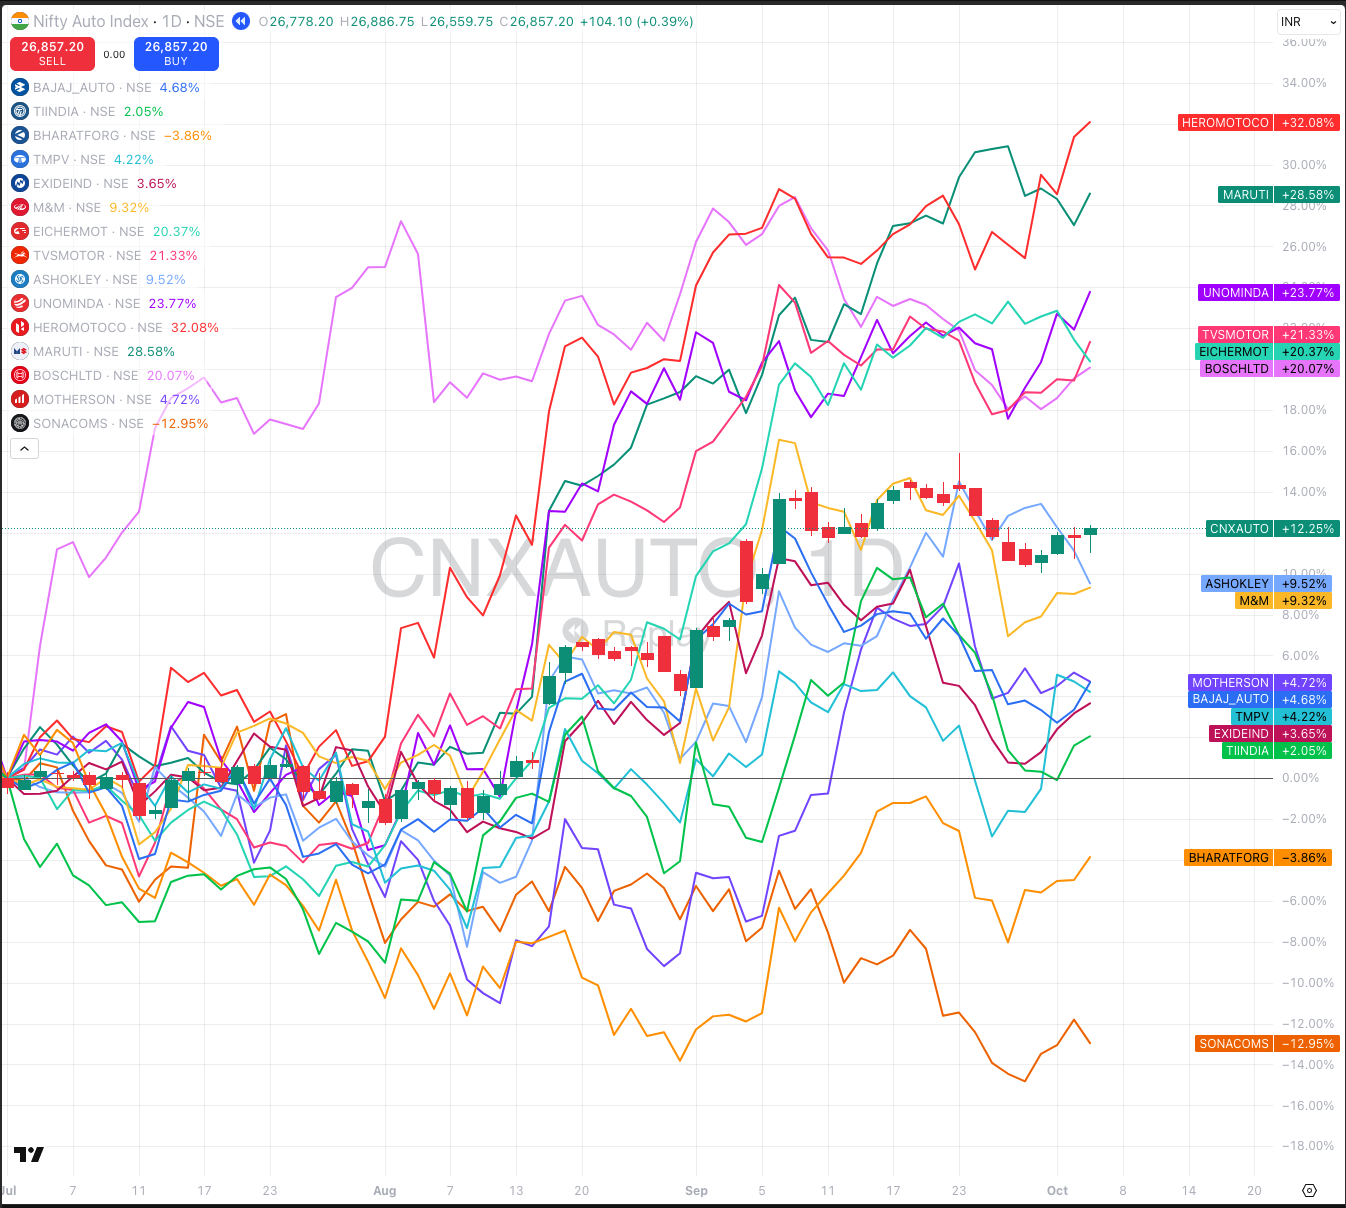
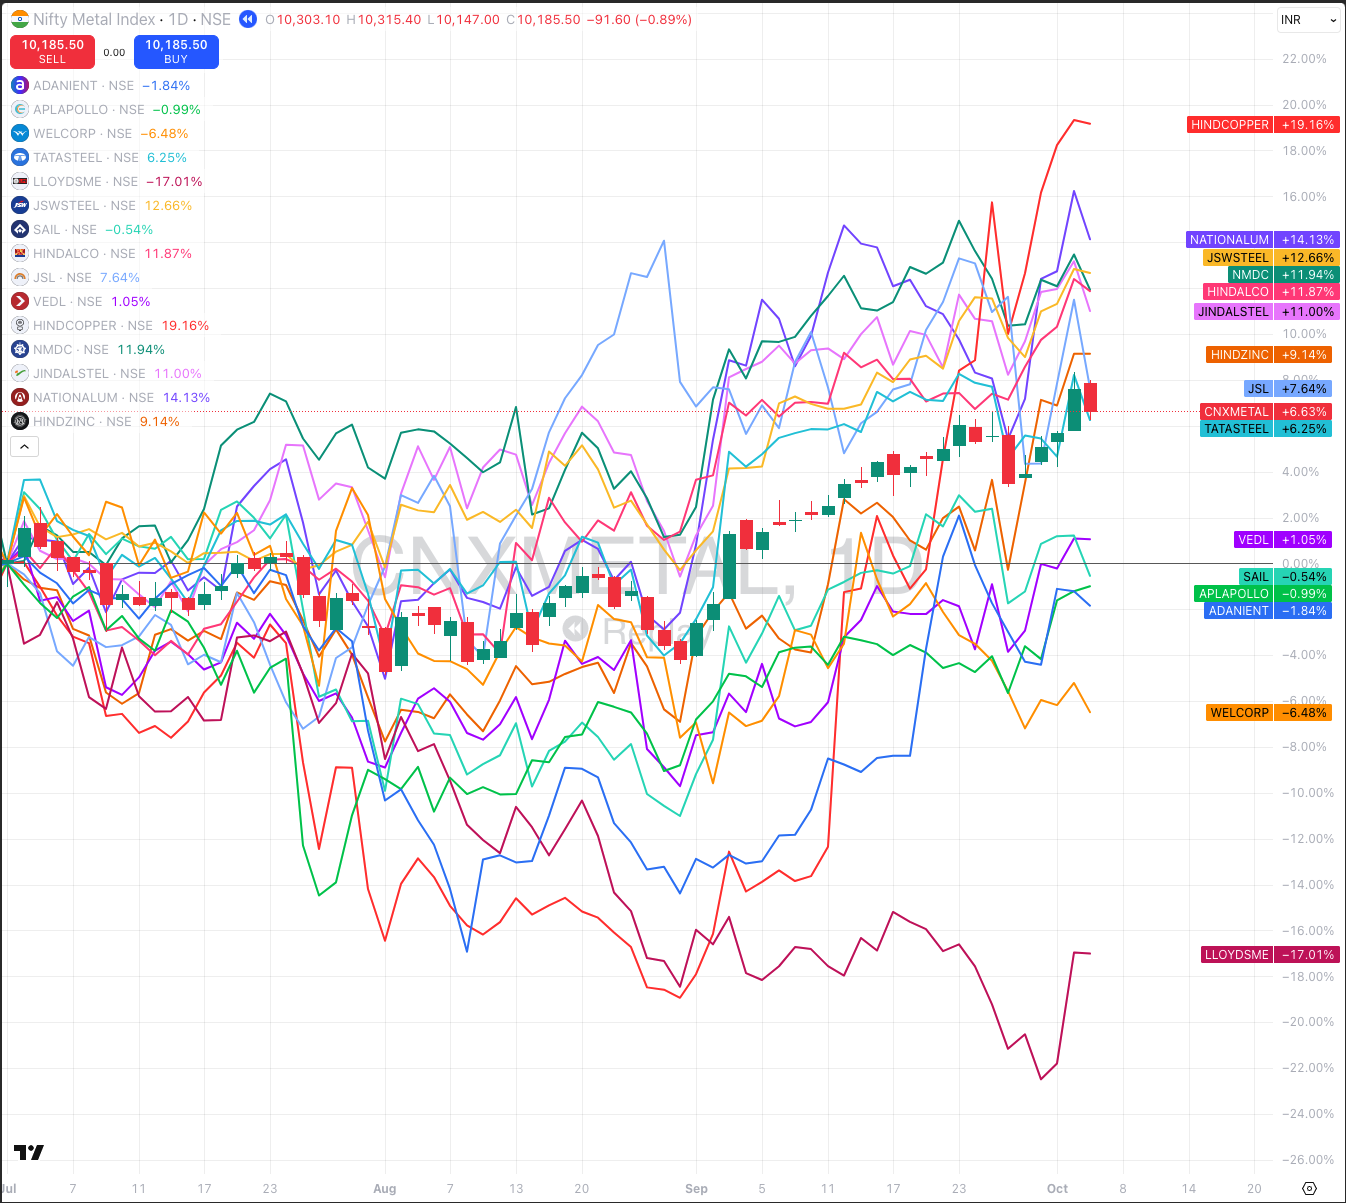
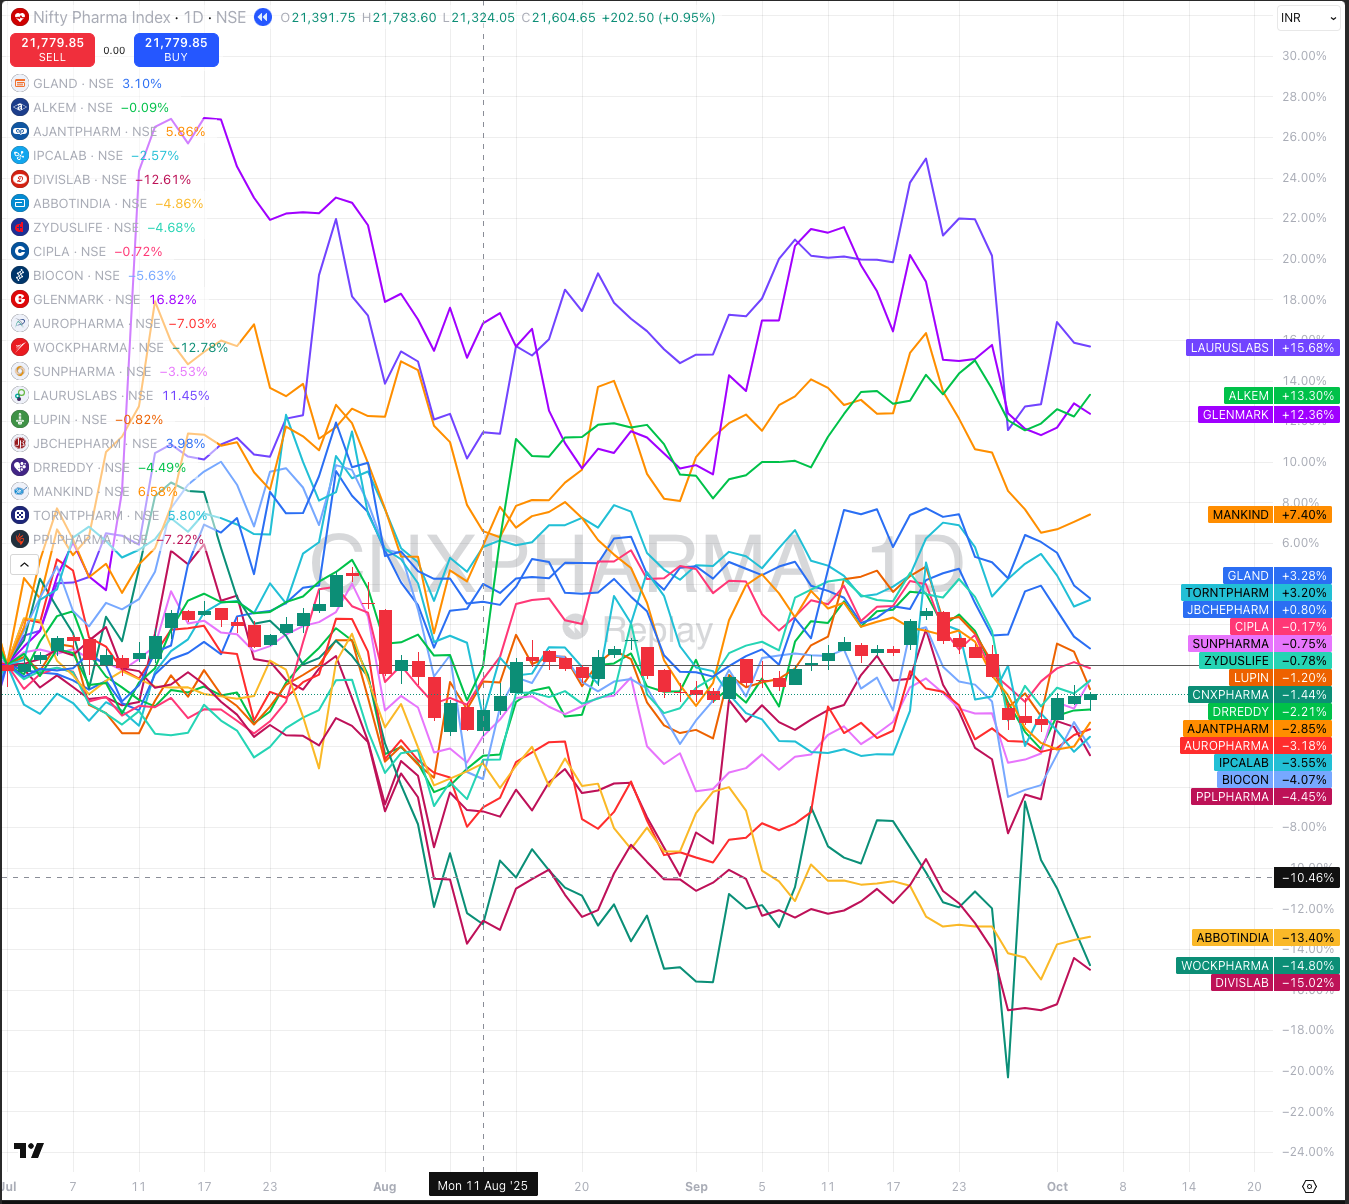
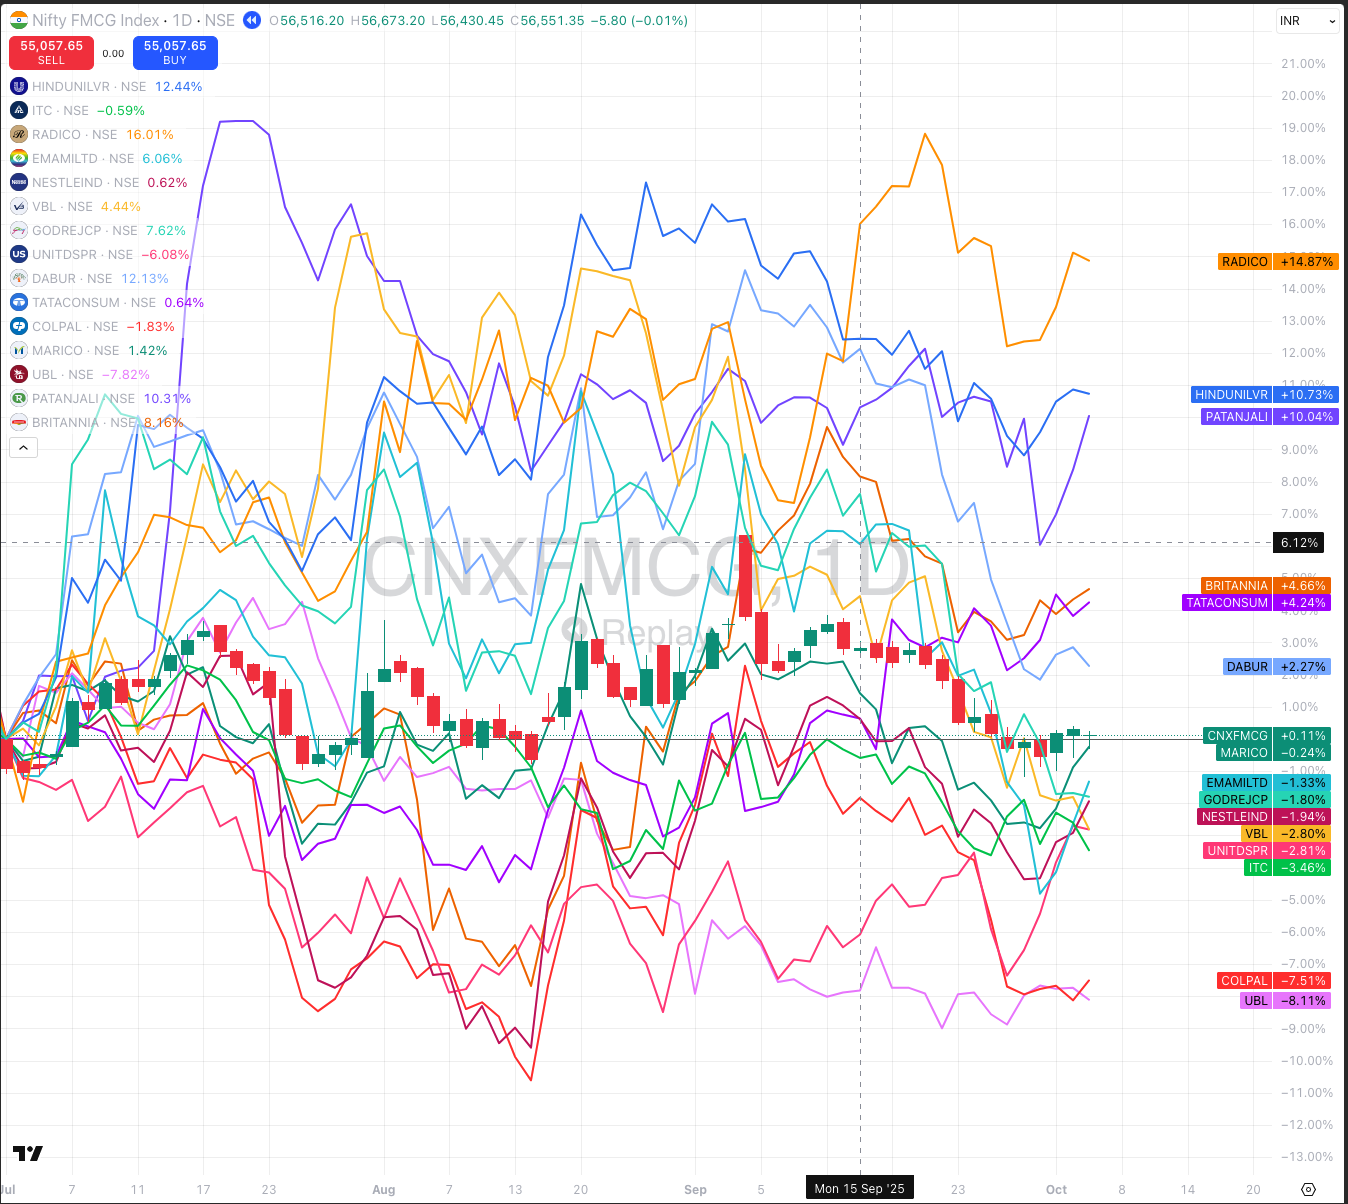
Step 3: Drill Down to Individual Outperformers
Once we have identified the “winning” sectors, we repeat the comparison process—but this time, we use the Sector Index as the benchmark instead of the Nifty.
The Process:
Open the chart of an outperforming sector (e.g., Nifty Auto).
Use the ‘Compare Symbol’ tool to add the top stocks within that specific sector.
Identify which stocks are trending above the sectoral average.

Mitesh Kumar, CMT is part of the India Core Team for CMT Association, serving as the Delhi & NCR Chapter Lead. An experienced algo trader, he specializes in building systematic quantitative strategies and also coaches individuals on achieving financial independence. As an instructor with Yubha, he is currently focused on supporting the growth of the CMT community in India.
Shared content and posted charts are intended to be used for informational and educational purposes only. CMT Association does not offer, and this information shall not be understood or construed as, financial advice or investment recommendations. The information provided is not a substitute for advice from an investment professional. CMT Association does not accept liability for any financial loss or damage our audience may incur.
