1/ Seasonals Suggest Weakness for August-September
The good news is we have wrapped the month of July, which turned out to be another month marked by a new all-time high for the S&P 500 index. The ok news is that this is actually quite common, as July has been a positive month for the S&P 500 about 87% of the time since the Great Financial Crisis. The bad news is August and September represent the weakest two-month sequence on the calendar!
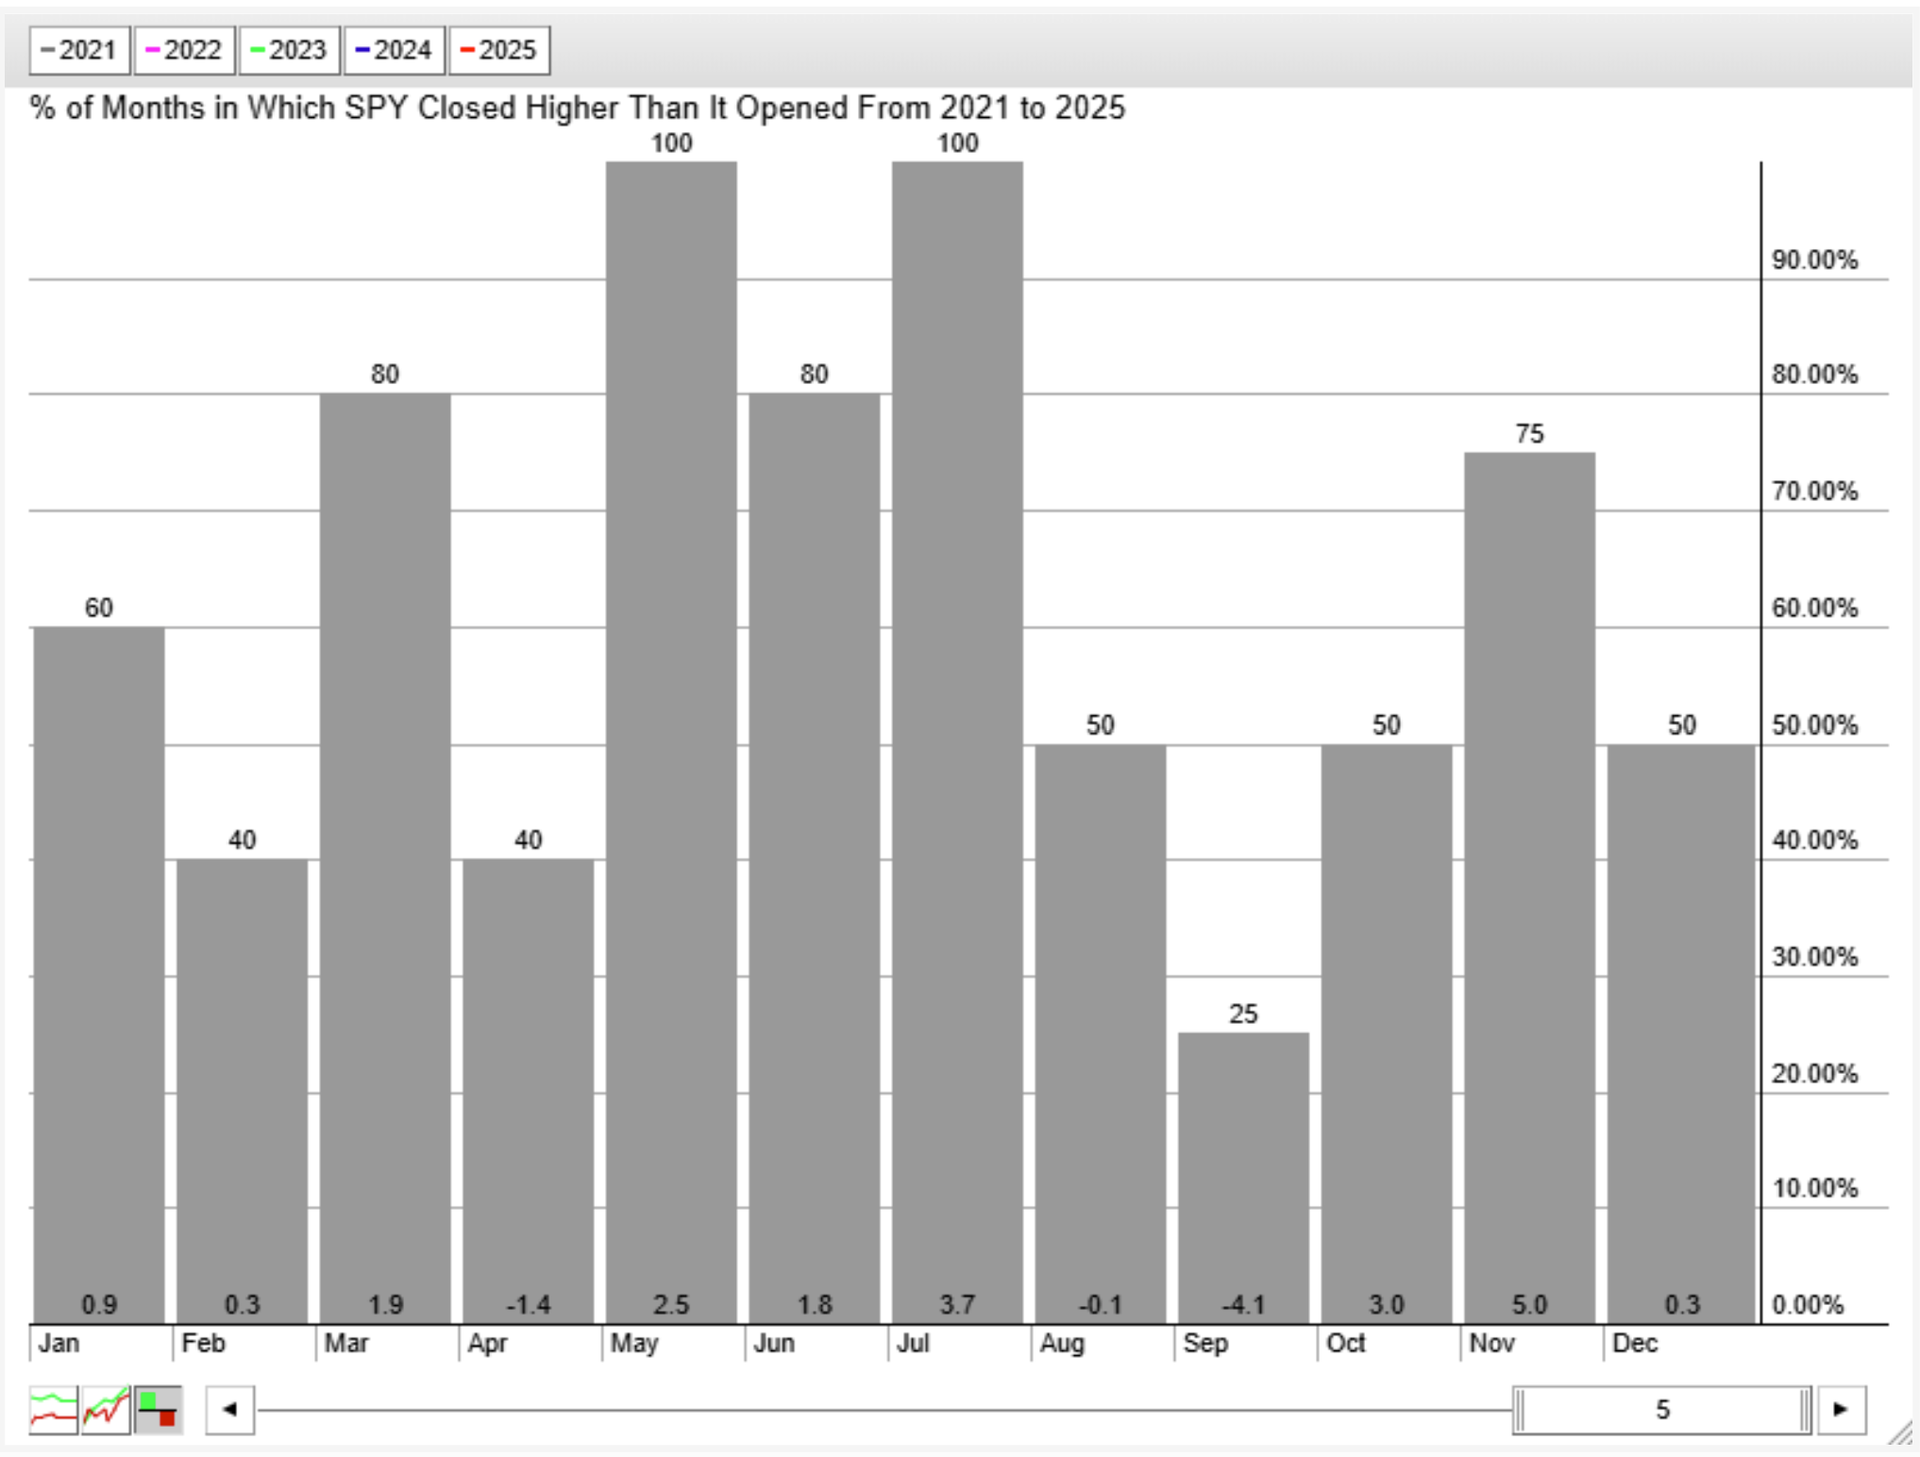
This seasonality chart from StockCharts shows that from 2010 through 2024, August is only up about half the time, with an average return -0.3%. September has literally been the worst month of all, with a similar batting average paired with an average return of -0.8%. This comes after an average return of +3.0% for the month of July.
I tend to think of seasonality studies as less “hard and fast” rules, and more like headwinds or tailwinds. The seasonals tell us what has often happened during that month, but the trend in the current month is far more important for investors to understand and appreciate.
2/ Nasdaq Bullish Percent Index Reveals Internal Weakness
The Bullish Percent Index is a market breadth indicator derived from point & figure charts. This particular version is looking at the Nasdaq 100 members, telling what percent of those 100 stocks are currently showing a bullish signal on their point & figure chart.
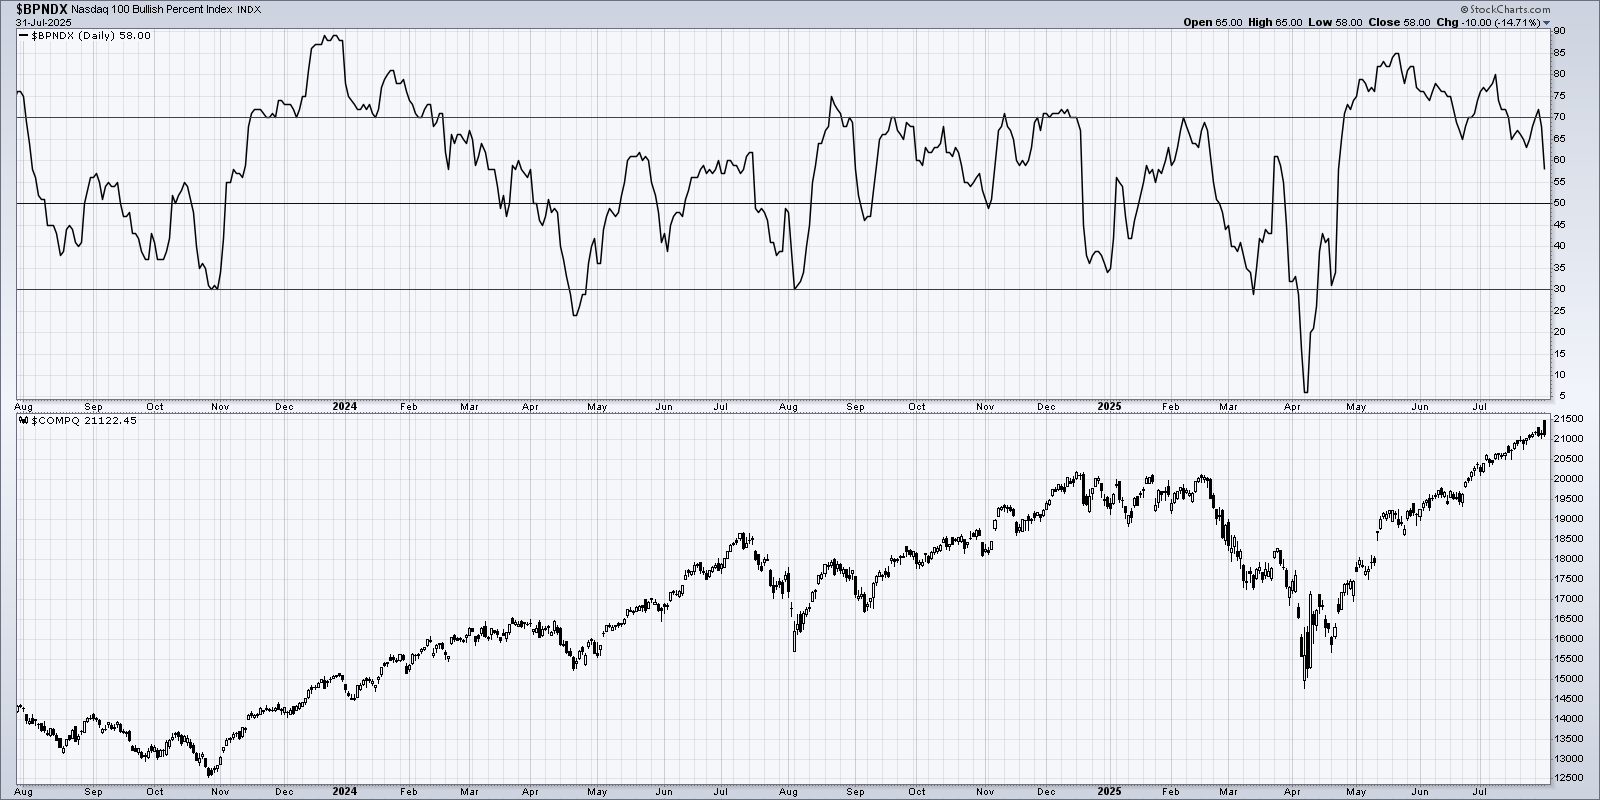
In mid-May 2025, as the Nasdaq Composite gapped higher above the 18,000 level, the Bullish Percent Index reached 85%. About a month later, as the Nasdaq Composite pushed above 20,000, the indicator eventually reached a peak around 80%. This week, as the Nasdaq achieved yet another new all-time high, the indicator sits just below 60%.
So to be clear, during the strong market rally over the last two months, about 25% of the Nasdaq 100 members have registered a sell signal on their point & figure charts. If you know point & figure charting, you’ll recognize that it is not an easy task to rotate from bullish to bearish signals. The price has to rotate in a meaningful way to change the direction of the chart. Our conclusion is that this rally phase is weakening for key growth stocks despite the strength in the major equity indexes.
3/ Equal-Weighted Technology ETF Hints at Rotation
Another way to gauge market breadth is to review equal-weighted indexes and see how they compare to their cap-weighted counterparts. Sector ETFs like the Technology Select Sector SPDR Fund (XLK) are quite top-heavy, with Nvidia (NVDA), Microsoft (MSFT), and Apple (AAPL) comprising just over 40% of the ETF. In this case, we’ll review the chart of the Invesco S&P 500 Equal Weight Technology ETF (RSPT).
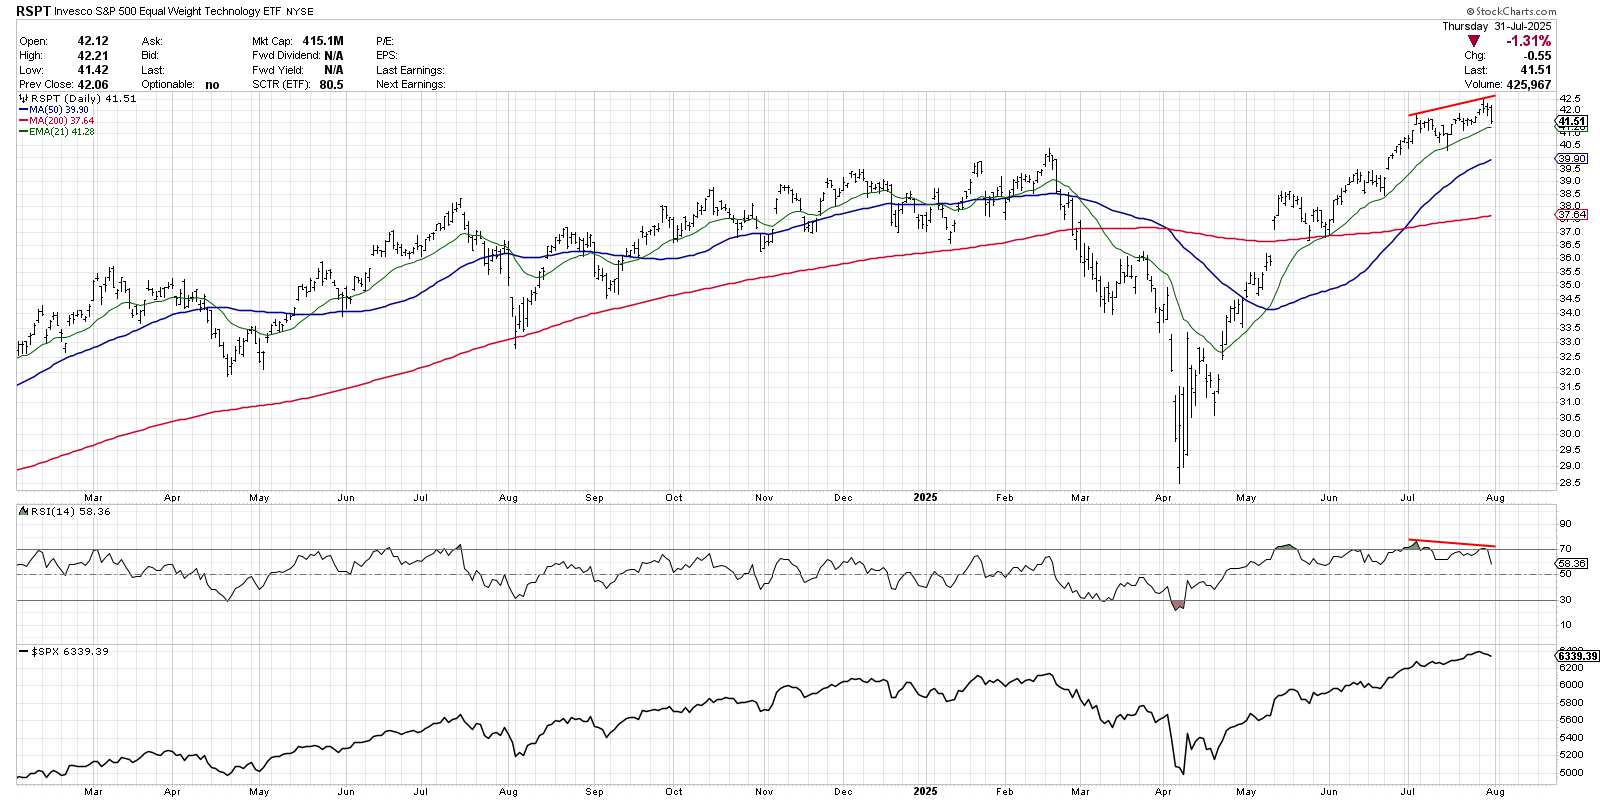
We can see a clear bearish momentum divergence in July, with the price of RSPT achieving new highs but with a lower value for the Relative Strength Index (RSI). The S&P 500 and Nasdaq 100, on the other hand, both achieved new highs in July with increasing momentum. With the equal-weighted technology sector flashing a bearish divergence that was not reflected in the cap-weighted counterpart, this tells me that the strength in the technology sector is more about the strength in the largest stocks in the sector.
Healthy bull market phases are driven by broad advances, as more and more stocks participate in the uptrend phase. Based on our analysis of breadth conditions, combined with the weak seasonality going into August and September, I’m looking for a very different market environment in the weeks to come.
Shared content and posted charts are intended to be used for informational and educational purposes only. CMT Association does not offer, and this information shall not be understood or construed as, financial advice or investment recommendations. The information provided is not a substitute for advice from an investment professional. CMT Association does not accept liability for any financial loss or damage our audience may incur.
