Investopedia is partnering with CMT Association on this newsletter. The contents of this newsletter are for informational and educational purposes only, however, and do not constitute investing advice. The guest authors, which may sell research to investors, and may trade or hold positions in securities mentioned herein do not represent the views of CMT Association or Investopedia. Please consult a financial advisor for investment recommendations and services
Natural Gas: Naughty or Nice?
It is that time of year when Jolly Old Saint Nicholas has made his list and is checking it twice. You better believe, he is going to know who has been naughty and who has been nice.
As traders and market analysts, it is not always easy to determine when a market is going to treat you nicely or when it will decide to be naughty. Although I have the beard, my hair is getting whiter, and my belly a little bigger with each passing year, I am not as wise and all-knowing as Santa Claus. Nevertheless, over the next week, I will channel my inner holiday spirit and, with the help of a few technical analysis tools and techniques, will examine various commodities and possibly a few equities to determine whether those markets will remain ‘nice’ or close beyond levels that would shift the outlook to ‘naughty’ as we head into the new year.
Natural gas is first on our list.
The prompt month January 2026 natural gas contract failed to extend the trend up from $3.913 and overcome an important $5.38 target again. Instead, prices gapped down on Monday and confirmed daily bearish momentum oscillator divergences and daily and weekly overbought signals. Prices fell aggressively for the remainder of the week. The bullish trendline up from $3.913 was broken, the last major swing low at $4.390 was taken out, and January settled the week below a bearish decision point at $4.21. The trend is now bearish, and a ‘nice’ market will challenge at least $3.96 early in the week. Settling below this will call for tests of the next major targets at $3.69 and $3.45 within the next few weeks.

https://www.kaseco.com/wp-content/uploads/2025/12/NGF26-Table-scaled.jpg
Nevertheless, support at $4.07 held on a closing basis on Friday, and the decline from $5.496 lacks a clear primary wave that will help to drive prices lower. A correction is due, and the daily Stochastic is oversold. Even so, the Stochastic can remain oversold for an extended period, and there are no other bullish patterns or signals. Volatility is high, so a correction could quickly challenge resistance at $4.37. Settling above this would call for a test of the ‘naughty’ resistance level at $4.62. Closing above $4.62 would not indicate that the move down is complete, but this would suggest that prices overextended to the downside and call for natural gas to move into its ‘naughty’ scenario, where a more substantial test of resistance and possibly a period of consolidation would occur.
Below are some of the recent technical factors used to determine the ‘naughty’ or ‘nice’ outlook for the next few weeks.
Nice (Bearish)
- Bearish breakaway gap
- Daily bearish KasePO, KaseCD, Stochastic, and MACD divergences
- Daily RSI and Stochastic overbought signals
- Weekly Stochastic overbought signal
- Settled below the:
- $4.21 smaller than target of the new primary wave down from $5.992
- $4.390 swing low
- Trendline up from $3.913
- Trading below all major daily moving averages, 20-day crossing below the 200-day
- Daily Kase Trend is bearish
- 10-day DMI bearish crossover, ADX is above 25 and flattening (trying to establish a downtrend)
Naughty (Bullish)
- Daily Stochastic is oversold (but can remain in that state for an extended period)
- Held the 89 percent retracement of the rise from $3.913
- Decline from $5.496 lacks a clear primary wave to sustain a downtrend
- Held the:
- $4.05 smaller than target of the wave down from $5.496
- $4.052 swing low
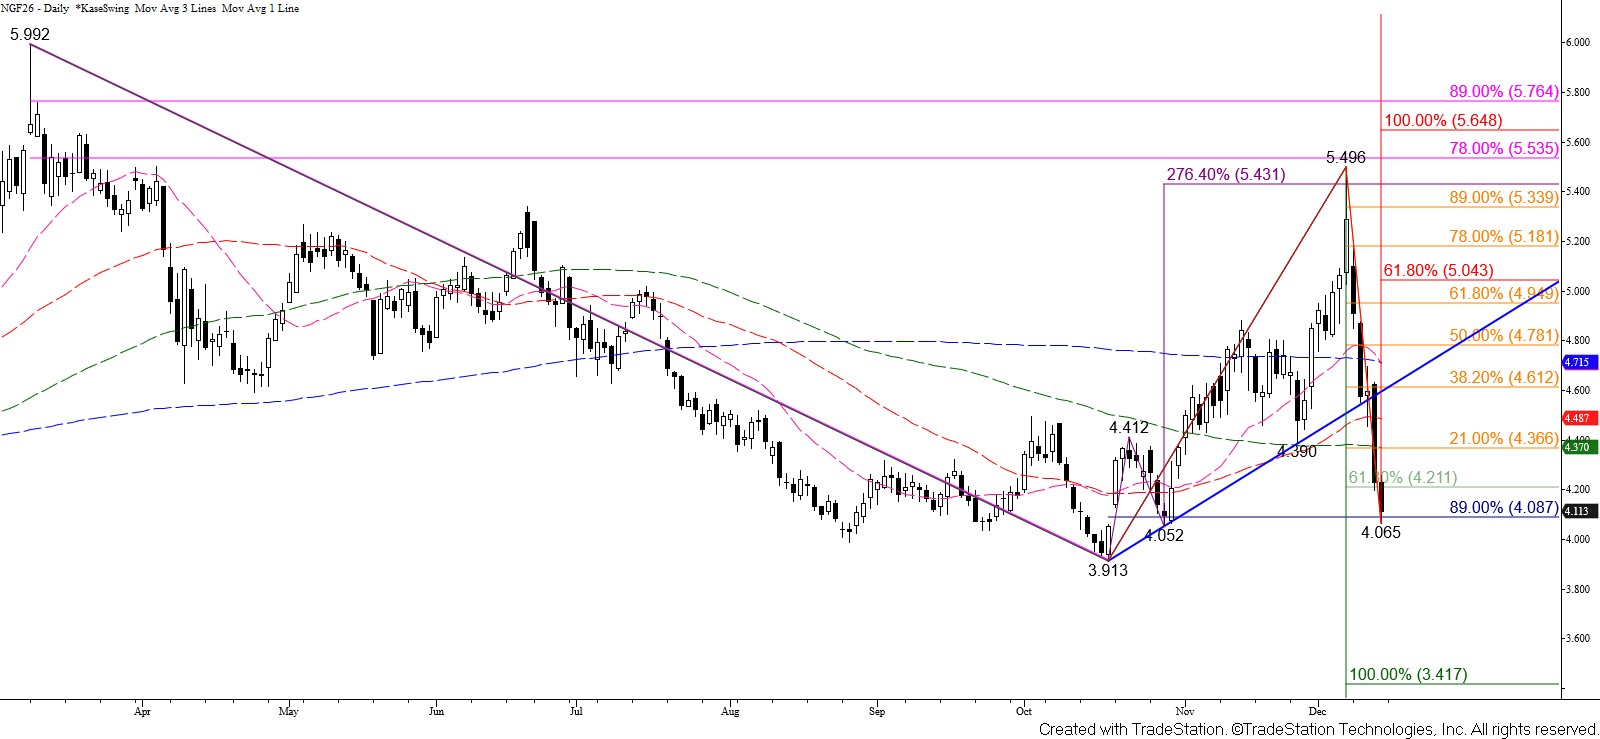
January Natural Gas Daily Chart
Natural gas quickly adopted a bearish outlook during the past week. The trend up from $3.913 failed to recapture and close above the $5.38 equal to (1.00) target of the prior primary wave up from $3.913 (invalidated) and the $5.43 XC (2.764) projection of the first wave up from $3.913 (purple). Instead, a bearish breakaway gap formed when the market opened late Sunday for Monday’s session. Daily bearish KasePO, KaseCD, Stochastic, and MACD divergences and daily RSI and Stochastic overbought signals were also confirmed on Monday. These signals reflected that the move up was exhausted and indicated that a reversal might occur. Ultimately, a weekly Stochastic overbought signal was also confirmed.

https://www.kaseco.com/wp-content/uploads/2025/12/NG.jpg
The move down paused near major support at $5.51 and the bullish trendline up from $3.913 (dark blue) on Wednesday, when a long-legged doji formed. The pause was short-lived, though. The move down accelerated again on Thursday, settling below the trendline, $3.51 support, the 50- and 100-day moving averages, and the $4.390 swing low. All of this confirmed that the uptrend had been broken. Friday’s close below the $4.21 smaller than (0.618) target of the new primary wave down from $5.992 (green) indicates that a downtrend is underway. This is because most waves that close beyond their smaller than target extend to at least the equal to target, in this case, $3.45.
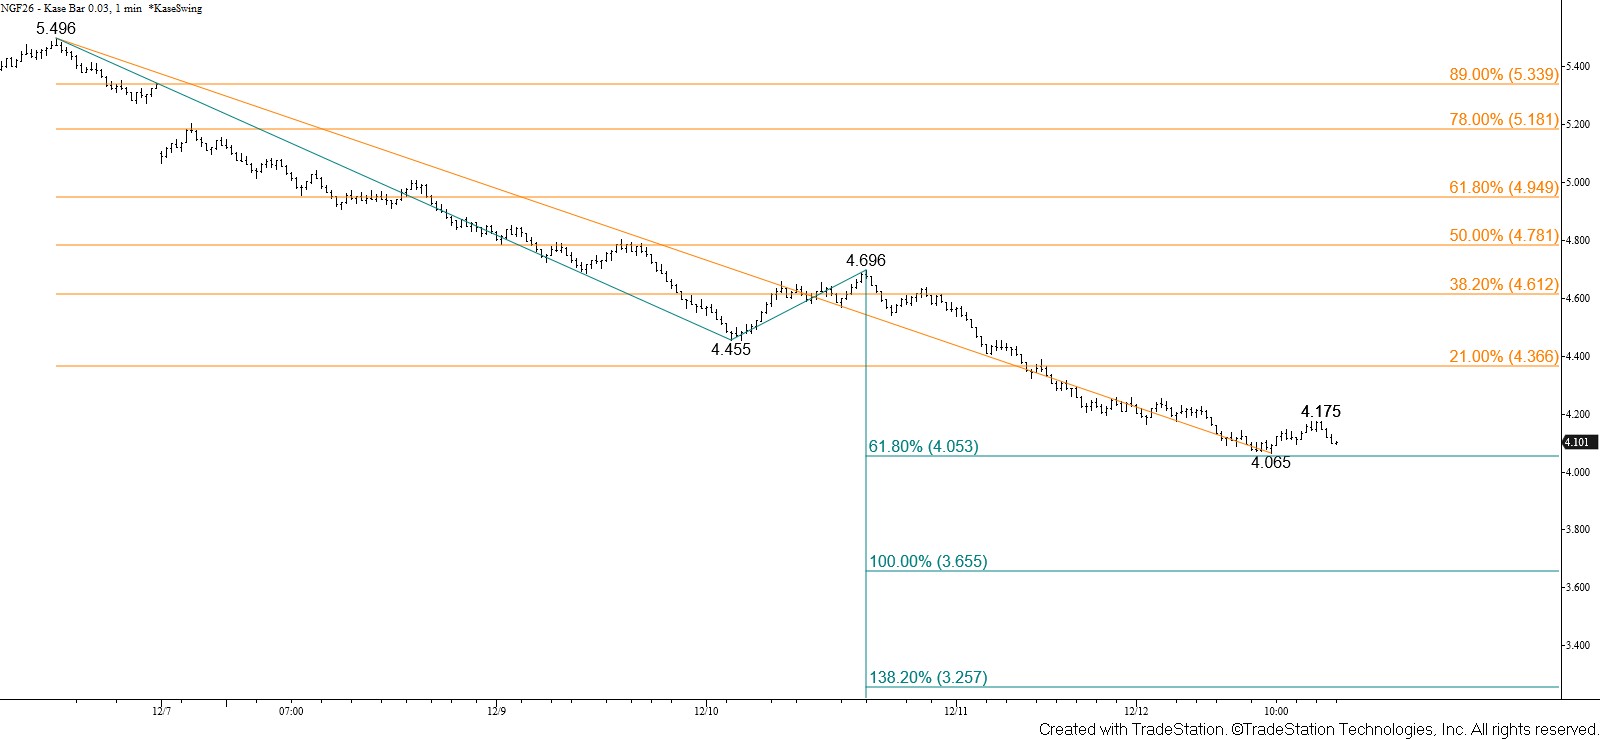
January Natural Gas $0.03 Kase Bar Chart
The outlook is firmly bearish heading into the new week. The biggest challenge for the move down from $5.496 is that it lacks a clear primary wave. Currently, the corrective leg $4.455 – $4.696 of the largest wave down from $5.496, was only a 21 percent retracement. Typically, the corrective leg of a primary wave will have at least a 38 percent retracement.

https://www.kaseco.com/wp-content/uploads/2025/12/NG-Intraday.jpg
Even so, the current wave down from $5.496 (dark cyan) projects to $4.07 as the smaller than target. This is also the 89 percent retracement of the rise from $3.913 (dark blue), and is a level that was held by Friday’s $4.065 low. This is a potential stalling point, but a close below $4.07 is expected. This will open the way for a test of $3.96 and then the $3.69 equal to target of the wave down from $5.496 in the ‘nice’ scenario. Settling below $3.69 will clear the way for the $3.45 equal to target of the primary wave down from $5.992 to be fulfilled. Because a correction is due, falling to $3.45 might take another few weeks. Also, given the importance of the $3.45 target, sustaining a close below this objective will probably be a challenge.
Weekly Natural Gas Continuation Chart
Given the decline that occurred during the past week, most of the forward curve is bearish. However, the uptrend on the weekly continuation chart (rolling first nearby) is intact. To break the continuation charts’ uptrend, natural gas must eventually sustain a close below the trendline up from $1.481 (blue) and take out the $2.622 swing low.
The targets for the January contract align with retracement levels up from $1.481 (dark blue) and $2.622 (blue) on the continuation chart. The $3.96 target, which sits just below the psychologically important $4.00 level, is the 38 percent retracement from $1.481. The $3.69 target is the 62 percent retracement from $2.622, the crucial $3.45 target is the 50 percent retracement from $1.481, and the $3.25 objective is the 78 percent retracement from $2.622. Therefore, even upon a decline to $3.45 within the next few weeks, as expected, the long-term uptrend on the continuation chart will remain intact.

https://www.kaseco.com/wp-content/uploads/2025/12/NG-Continuation.jpg
Natural Gas ‘Naughty’ Scenario
As stated, the move down is due for a correction soon. Holding $4.07 support, the lack of a clear primary wave down from $5.496, and an oversold daily Stochastic warn that a correction might occur early in the week. Volatility is high, so the correction could be significant. Initial resistance is the 21 percent retracement from $5.496 (orange) and the 100-day moving average at $4.37. Settling above this would call for a test of key resistance and the 38 percent retracement at $4.62. A normal correction within the ‘nice’ scenario will hold $4.62. Closing above $4.62 would not mean that the move down has ended, but this would put natural gas into its ‘naughty’ scenario and call for a more substantial test of resistance where the next major threshold is the 62 percent retracement at $4.94. Settling above $4.94 would reflect a major shift in bullish sentiment and imply that the move down is complete. Closing above $5.04, the smaller than target of the new primary wave up from $3.913 (red), would confirm a renewed bullish trend. Such a move is doubtful without a firm and lasting bullish shift in weather or other fundamental factors.

Dean Rogers, CMT, has been a member of the CMT Association for 17 years. He has over 25 years of experience as a technical analyst specializing in trading indicators and systems development, writing award-winning forecasts for the energy and metals commodity markets, and creating hedging and risk management strategies. Dean is the President of Kase and Company, Inc.

Shared content and posted charts are intended to be used for informational and educational purposes only. CMT Association does not offer, and this information shall not be understood or construed as, financial advice or investment recommendations. The information provided is not a substitute for advice from an investment professional. CMT Association does not accept liability for any financial loss or damage our audience may incur.
