1/ US Yields – Symmetrical Triangle
Chart patterns aren’t my specialty – however I do believe certain patterns contain important information for investors. The symmetrical triangle pattern is displaying on the US 10-year Treasury Note Yield (TNX). This pattern is characterized by two converging trend lines connecting a series of sequential peaks and troughs. The trend lines form a narrowing pattern that resemble a triangle. TNX has respected the downtrend line from the 2025 highs – as it’s respected the uptrend line from the 2024 lows.
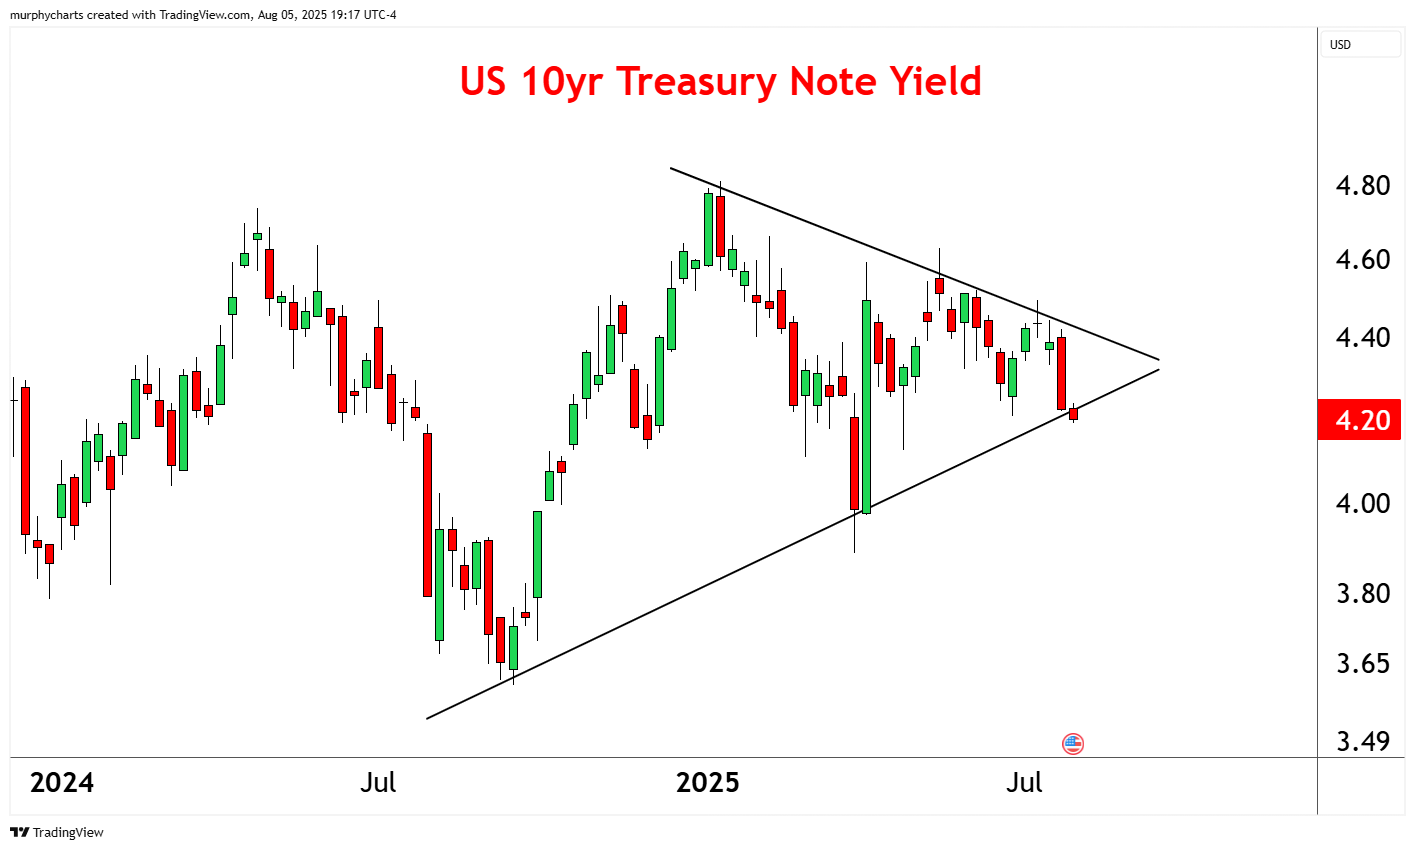
While I don’t believe this pattern to be predictive – it highlights the consolidating nature of the asset. As yields coil, traders anticipate a breakout in either direction. I’m very curious to see how this pattern resolves in the coming weeks!
2/ Going Nuclear!
Nuclear stocks are a great example of the principle of polarity in action! As prior resistance tends to form new support – and vice versa. The industry group is up over 45% year-to-date as it continues to trek toward new highs.
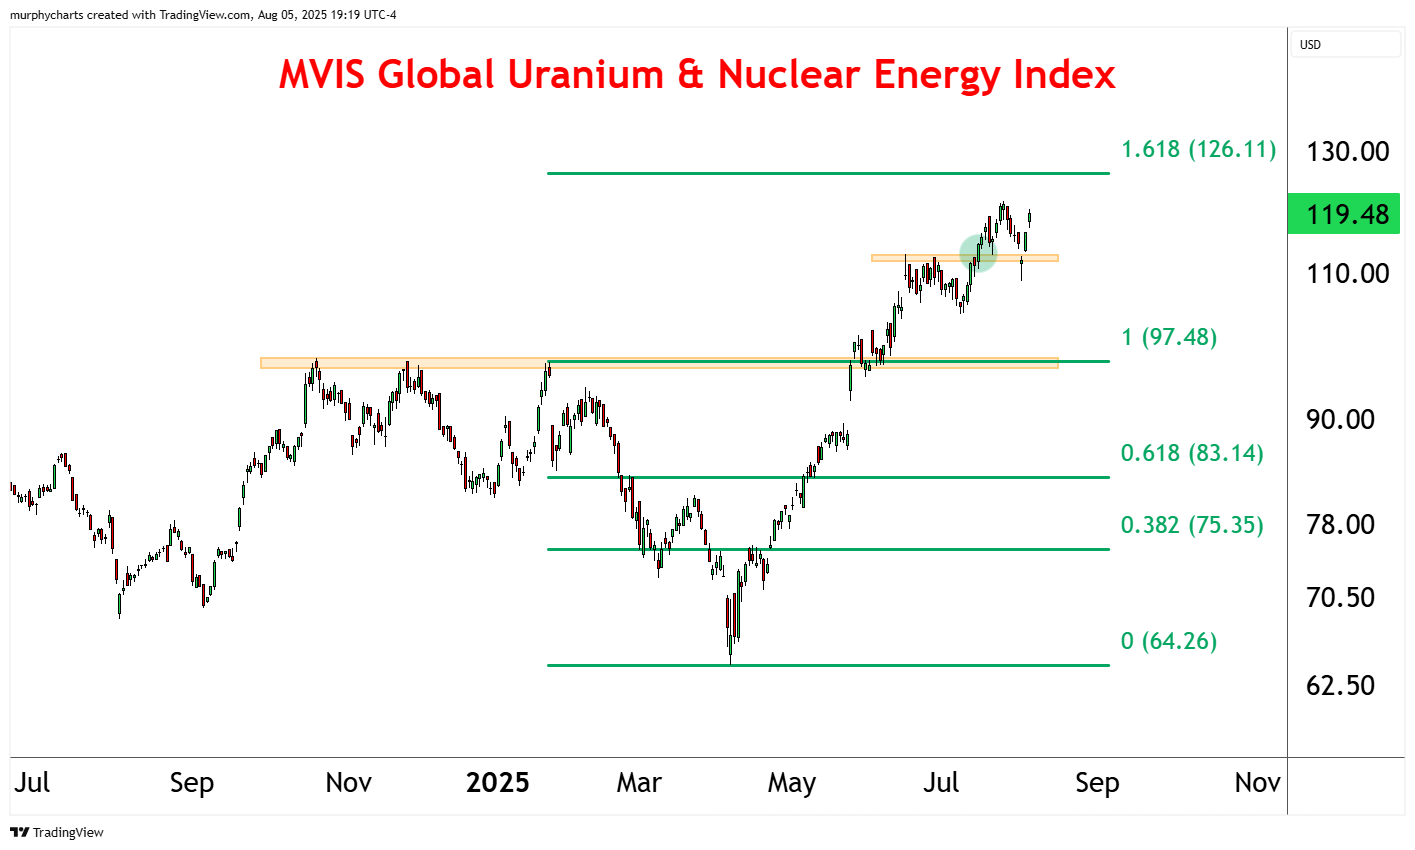
The Fibonacci extension from the 2024 highs to the 2025 lows is piquing my interest. The 1.618 extension is only ~5% away – this level is often viewed as a price target for short-term traders. Some may expect profit taking or price consolidation if the asset where to reach this level. One thing we know for sure – the asset is trending. How long it persists is anyone’s guess. Some momentum indicators are displaying signs of exhaustion, but price is proving resilient!
3/ Gold Miners – New Highs
Gold miners reached fresh 52-week highs this week. After consolidating all summer long, price is finally breaking out! I find this incredibly interesting, especially because the yellow metal is yet to resolve through its own consolidation phase. Are the miners signaling higher gold prices are to come?
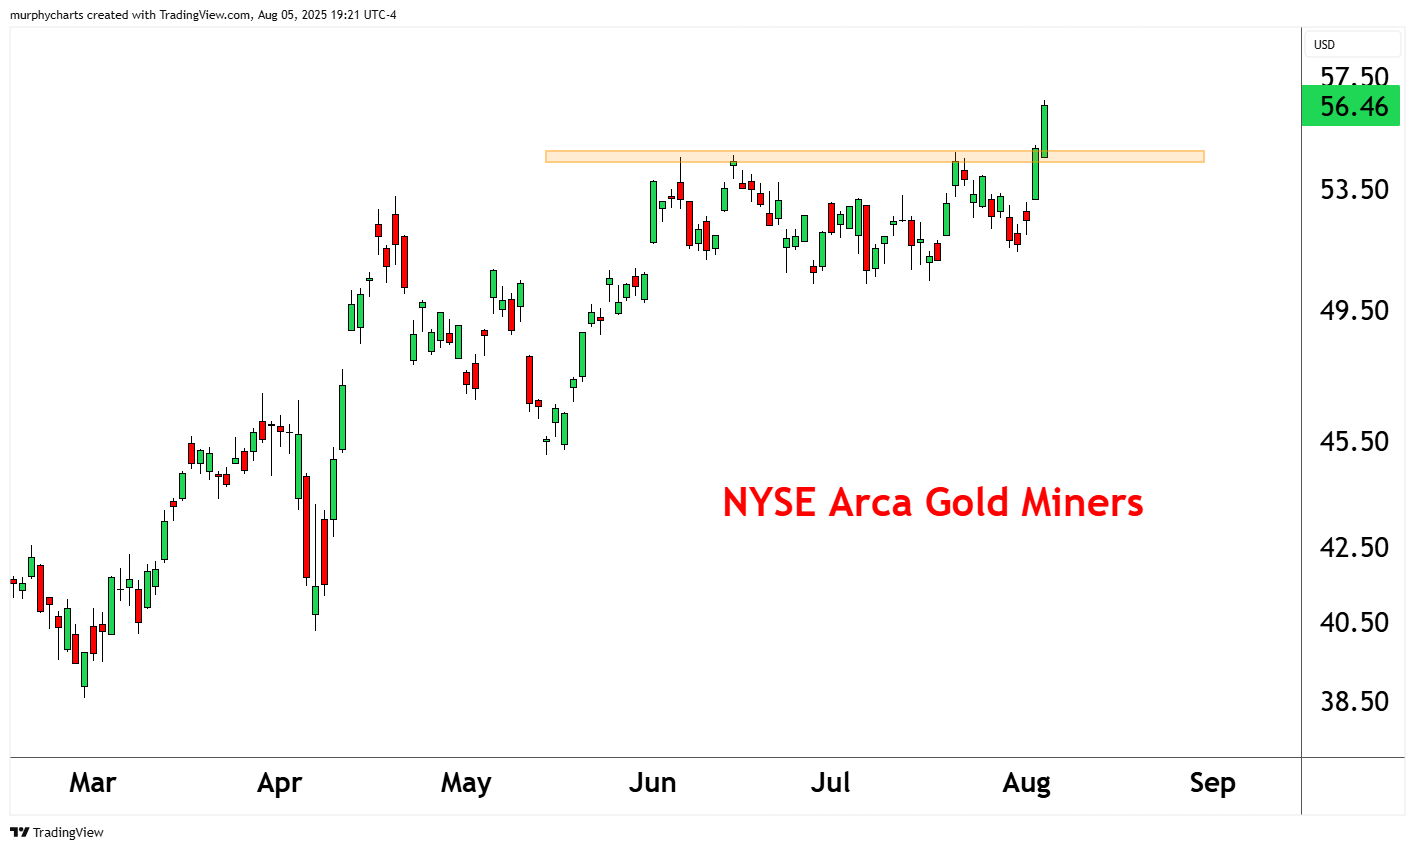
The miners have outperformed the hard asset all year long. This breakout coincides with new multi-year relative highs versus Gold prices. Historically, when the miners are outperforming gold prices, it coincides with gold outperforming equity assets. Will history repeat? Only time will tell.
Shared content and posted charts are intended to be used for informational and educational purposes only. CMT Association does not offer, and this information shall not be understood or construed as, financial advice or investment recommendations. The information provided is not a substitute for advice from an investment professional. CMT Association does not accept liability for any financial loss or damage our audience may incur.
