1/ Offense Over Defense Says “Risk On” For Stocks
Legendary technical analyst Bill Doane, who ran the technical research team at Fidelity in the 1970s, explained that they saw one of their chief goals as to determine whether the “offense” or “defense” was in control of the market. My favorite ratio to track this relationship is very much favoring offense going into August.
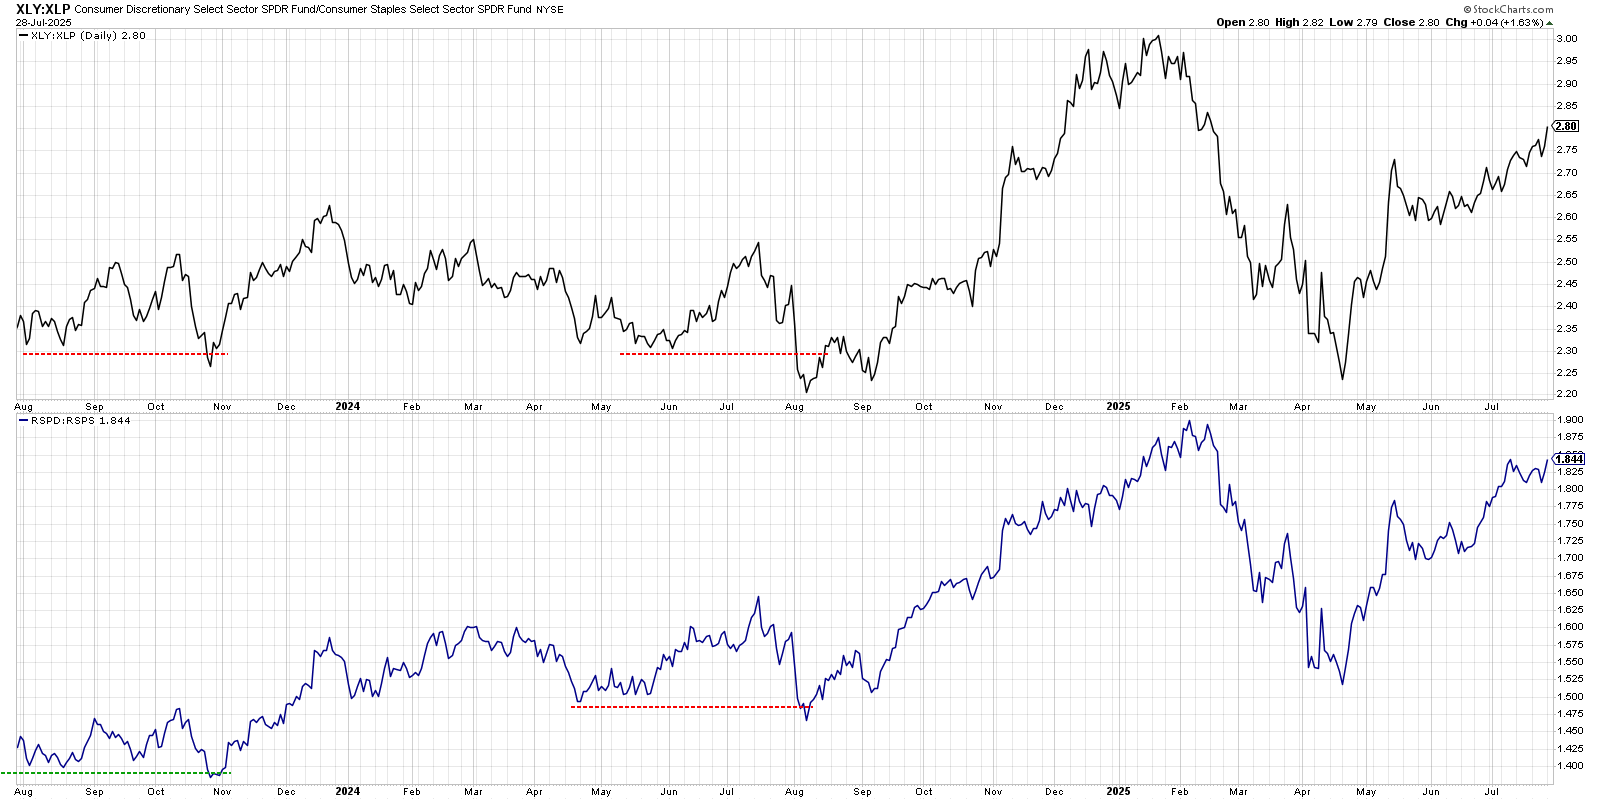
The top panel tracks a simple ratio of the Consumer Discretionary Select Sector SPDR Fund (XLY) and the Consumer Staples Select Sector SPDR Fund (XLP). The bottom panel uses equal-weighted ETFs tracking those same two sectors. By tracking the movements in these two ratios, we can determine whether investors are rotating more to “things you want” or “things you need.”
With both ratios making new three-month highs in July, this confirms that investors are favoring “things you want” and suggests strong optimism for stocks. If and when that ratio starts to turn lower, perhaps during the seasonally weaker months of August and September, that would mean more defensive positioning for investors and a more cautious conclusion for this basic gauge of investor sentiment.
2/ One Specialty Retailer Baking Up New Three-Month Highs
Let’s look at two stocks from the Consumer Discretionary sector that feature constructive chart patterns in recent weeks. First, we’ll review the chart of Williams Sonoma Inc. (WSM).
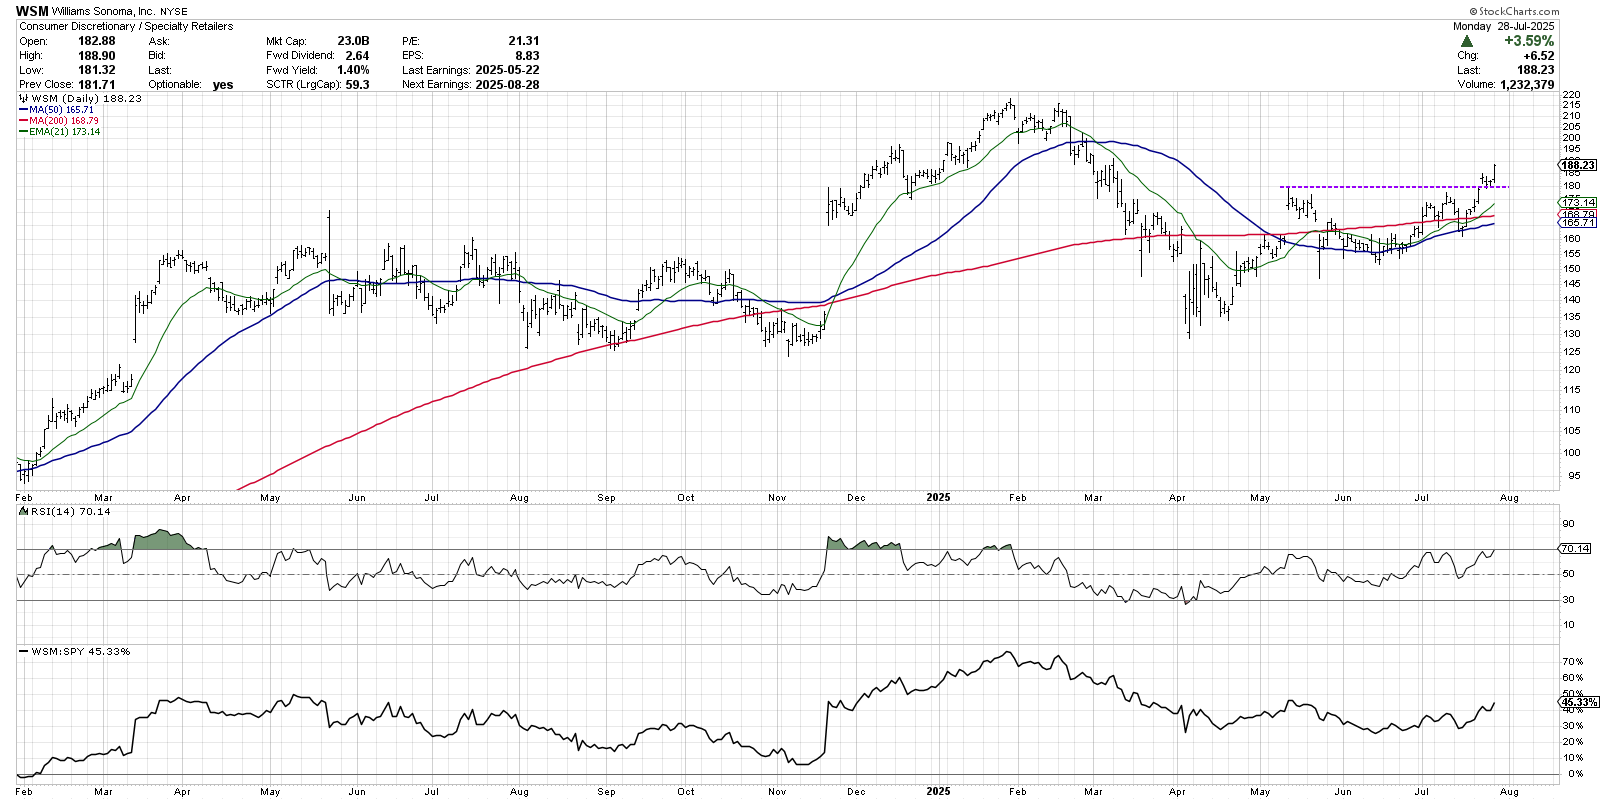
Last week, WSM popped above resistance around $180, taking the stock above the price peak from early May. This move to a new swing high came after WSM had found support at a cluster of moving averages, forming another higher low since the April market bottom.
At the June and July swing lows, the Relative Strength Index (RSI) remained above the crucial 40 level. Using the “range rules” approach with RSI, as popularized by legendary technical analyst Connie Brown, we can confirm a bullish phase for WSM. As long as the RSI holds that 40 level on subsequent pullbacks, we’ll remain optimistic that this consumer name could retest its January all-time high.
3/ Break Above the 200-Day? Just Do it.
Shares of Nike Inc. (NKE) have experienced a similar pattern of a breakout and then pullback, but in this case, the 200-day moving average has played a key part in the analysis. With a move back above the 200-day moving average, and improving trend characteristics, we see NKE as having rotated from a bearish to bullish phase.
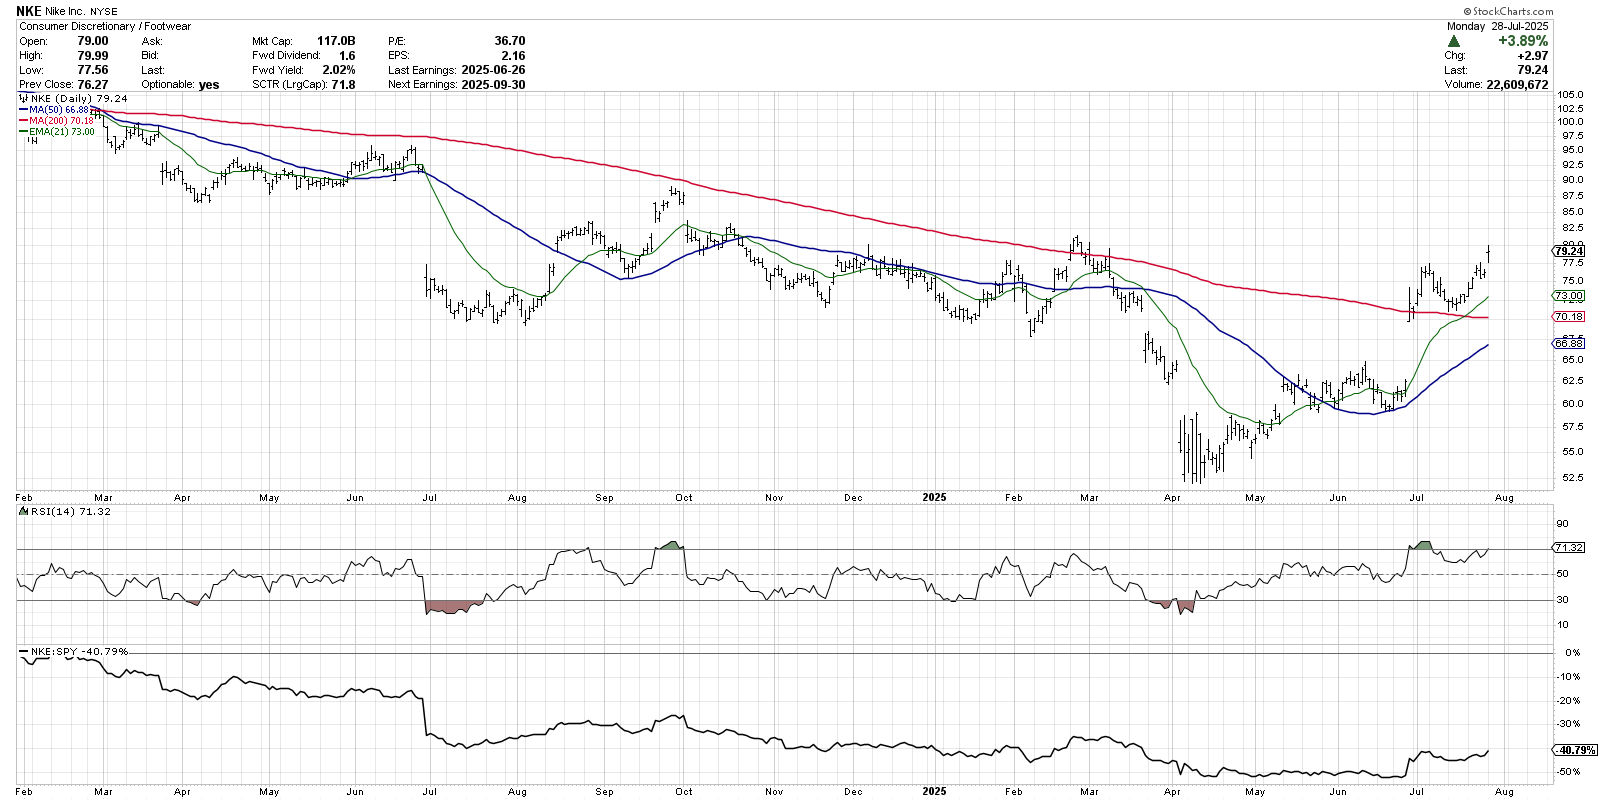
Going into the April low, NKE was showing all the classic signs of distribution. Price was making lower lows and lower highs, the moving averages were all sloping downwards, and the RSI was consistently in the bearish range below 60. After an initial rally into May, Nike eventually pushed back above the 21-day exponential moving average and 50-day simple moving average.
After its June 26th earnings release, NKE finally popped back above the 200-day moving average, followed by a classic pullback to retest moving average support. With the stock back above the 200-day moving average, and the RSI back into the bullish range, we’re seeing a confirmed uptrend phase until proven otherwise.
With this particular setup, the 21-day exponential moving average can often serve as an initial warning sign of an exhaustion of buyers. But until we see a valid breakdown below this short-term trend gauge, we’re expecting further upside for this thriving footwear stock.
Shared content and posted charts are intended to be used for informational and educational purposes only. CMT Association does not offer, and this information shall not be understood or construed as, financial advice or investment recommendations. The information provided is not a substitute for advice from an investment professional. CMT Association does not accept liability for any financial loss or damage our audience may incur.
