
This week’s CPI report came in slightly below expectations, but Core CPI was a touch hotter than forecast.
Despite that, the market has doubled down on its rate cut bets.
- September: Nearly 100% chance of a 25 bps cut
- October: Another cut priced in
- December: A third cut expected
- Total: Three cuts in 2025 now baked into expectations
The optimism is clear and equities are rallying, yields are easing, and traders are talking about a Santa Claus rally before we’ve even hit fall.
But here’s the risk:
If the Fed doesn’t match this script, sentiment could flip fast. That could mean sharp volatility, failed breakouts, and a quick test of support levels.
From a technical perspective:
- Short-term momentum is strong, but extended
- Key resistance is forming near recent highs
- Treasury 2-year yield is the cleanest read on rate cut conviction
- Any disappointment from the Fed could trigger a momentum unwind
What to watch into September:
- FOMC statement and dot plot for validation of cut expectations
- Price action around major equity index resistance
- Bond market shifts, especially in the short end of the curve
The bottom line:
The market is trading on a dovish story, not confirmed policy. That can work in the short term, but if the Fed blinks, technical setups could reverse quickly.
Sector Rotation Signals from RRGs
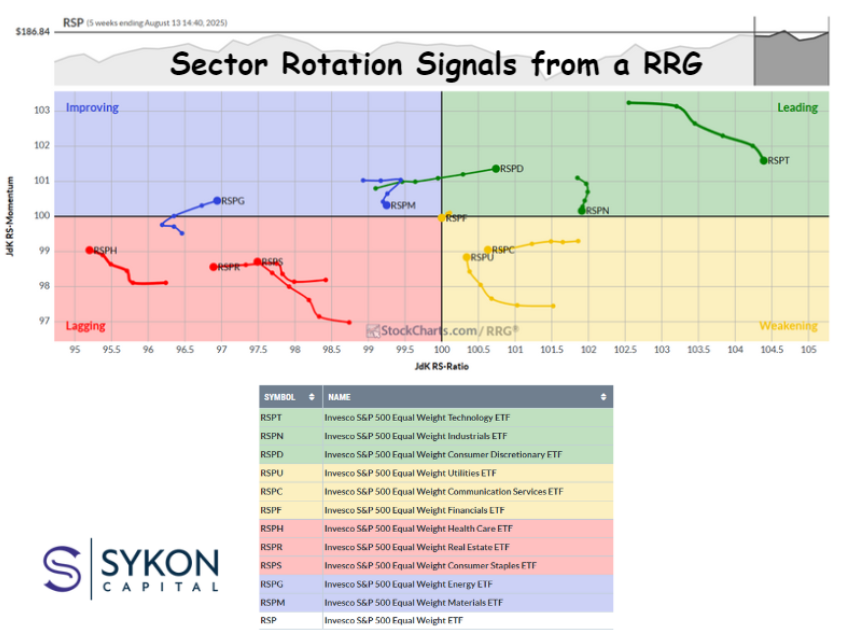
If you’ve followed my work, you know I’m a big fan of Relative Rotation Graphs (RRGs).
They’re one of the best ways to visualize sector performance relative to a benchmark, in this case, the S&P 500 Equal Weight ETF (RSP).
By focusing on equal weight sectors, we strip out mega-cap distortions and get a cleaner read on broad market rotation.
Current observations:
- Consumer Discretionary is ramping into the Leading quadrant — a sign of improving breadth beyond just tech.
- Healthcare is moving from Lagging toward Improving, and because it’s already on the outer edge of the RRG, this rotation could be powerful. This sector is both undervalued and largely unloved.
- Utilities are turning clockwise from Weakening into Leading , driven by defensive demand and potential profitability tied to infrastructure build-outs.
Why utilities matter here:
- They benefit from federal infrastructure initiatives and deregulation themes.
- Utility infrastructure is critical for AI growth initiatives, creating a secular tailwind.
- The sector’s leadership is not just defensive, it’s tied to real earnings potential.
Key technical takeaways:
- Rotation strength in Consumer Discretionary suggests buyers are broadening out beyond tech leadership.
- Healthcare’s positioning offers a potential contrarian opportunity.
- Utilities could surprise with both price momentum and fundamental support.
The bottom line:
Sector rotation is gaining complexity, and opportunity. Watching the RRGs gives us a potential edge in spotting these shifts before they’re obvious on price charts.
GLD Weekly Chart àBollinger Band Analysis

The weekly chart of GLD shows a strong, sustained uptrend that began in early 2023. Price has moved from roughly $170 to around $308, an 81% gain over about 2.5 years, with a clear stair-step pattern of higher highs and higher lows.
Current technical picture:
- Trend: Strong uptrend remains intact, with price holding above the middle Bollinger Band for most of the rally.
- Bollinger Band position: Price is near the upper band and has been oscillating between the middle and upper bands — typical in persistent bullish trends.
- Consolidation: Since May 2025, GLD has traded in a tight range between $300–$316, forming a potential continuation base after a sharp rally.
Support levels:
- Primary: $300–$305 (recent bounce zone)
- Secondary: $280 (March 2025 breakout level)
- Major: $245–$250 (late 2024 consolidation area)
Resistance levels:
- Immediate: $316 (June 2025 high)
- Psychological: $320 (round-number resistance)
Probability assessment:
- Bias: Higher probability of an upside breakout following consolidation
- Trend strength remains high
- Price consistently above the middle Bollinger Band
- Pullbacks remain shallow and are quickly bought
- Macro backdrop supports gold in periods of uncertainty and inflation concern
- Risks:
- Momentum has eased during consolidation
- A decisive break below $300 could open a retest of $280
Bottom line:
The technical structure favors continuation of the uptrend, but a clean close below $300 would shift focus to deeper support. For now, the path of least resistance remains to the upside.

Shared content and posted charts are intended to be used for informational and educational purposes only. CMT Association does not offer, and this information shall not be understood or construed as, financial advice or investment recommendations. The information provided is not a substitute for advice from an investment professional. CMT Association does not accept liability for any financial loss or damage our audience may incur.
