While You Were Sleeping on Microcaps
In the past three sessions stocks have rebounded impressively at every level of market capitalization. However the strongest rebound can be found among the index that tracks those stocks with a market capitalization of $300 million or less. These are the microcap stocks. Companies you likely have never heard of nor cared to seek out. And they are roundly outperforming their larger-company counterparts.

After investors settled down and got over their fears of runaway inflation from tariffs last April, stocks have roared higher. This chart shows the Nasdaq 100 index, as tracked by QQQ, improving roughly 40% at its highest point since that time. By contrast, iShares’ microcap ETF (IWC) has risen more than 50% in the same period.
It might be easy to dismiss this move by simply saying that the higher volatility of that asset class and its low-priced stocks would simply provide a higher beta, creating more reward with more risk. But that explanation falls short when considering the index in between: the Russell 2000.
Considering iShares’ better-known ETF that tracks the small cap index (IWM), you could apply the same standard and expect that IWM would have outperformed QQQ since April for the same reason–more volatility, more reward that comes from more risk. However that isn’t how things have played out. IWM (depicted by the blue line on the chart) clearly underperformed QQQ when measured from the same starting point.
The only remaining information to deduce is that investors clearly have a higher appetite for unusual risk right now. Perhaps those done holding on to Bitcoin are looking for similar returns elsewhere? Whatever the reason, microcaps continue to show relative strength compared to the rest of the market.

Market Likes Mark’s Thinking
Meta (META) has had a tough time getting investors to take its business seriously. One must find it difficult to get meaningful coverage from analysts and friendly media types after producing an earnings announcement that featured a bottom line miss of 84%. Tsk, Tsk, what’s a young CEO to do? Perhaps donning big boy clothes and schmoozing with your bitter-rival competitors is a good place to start.
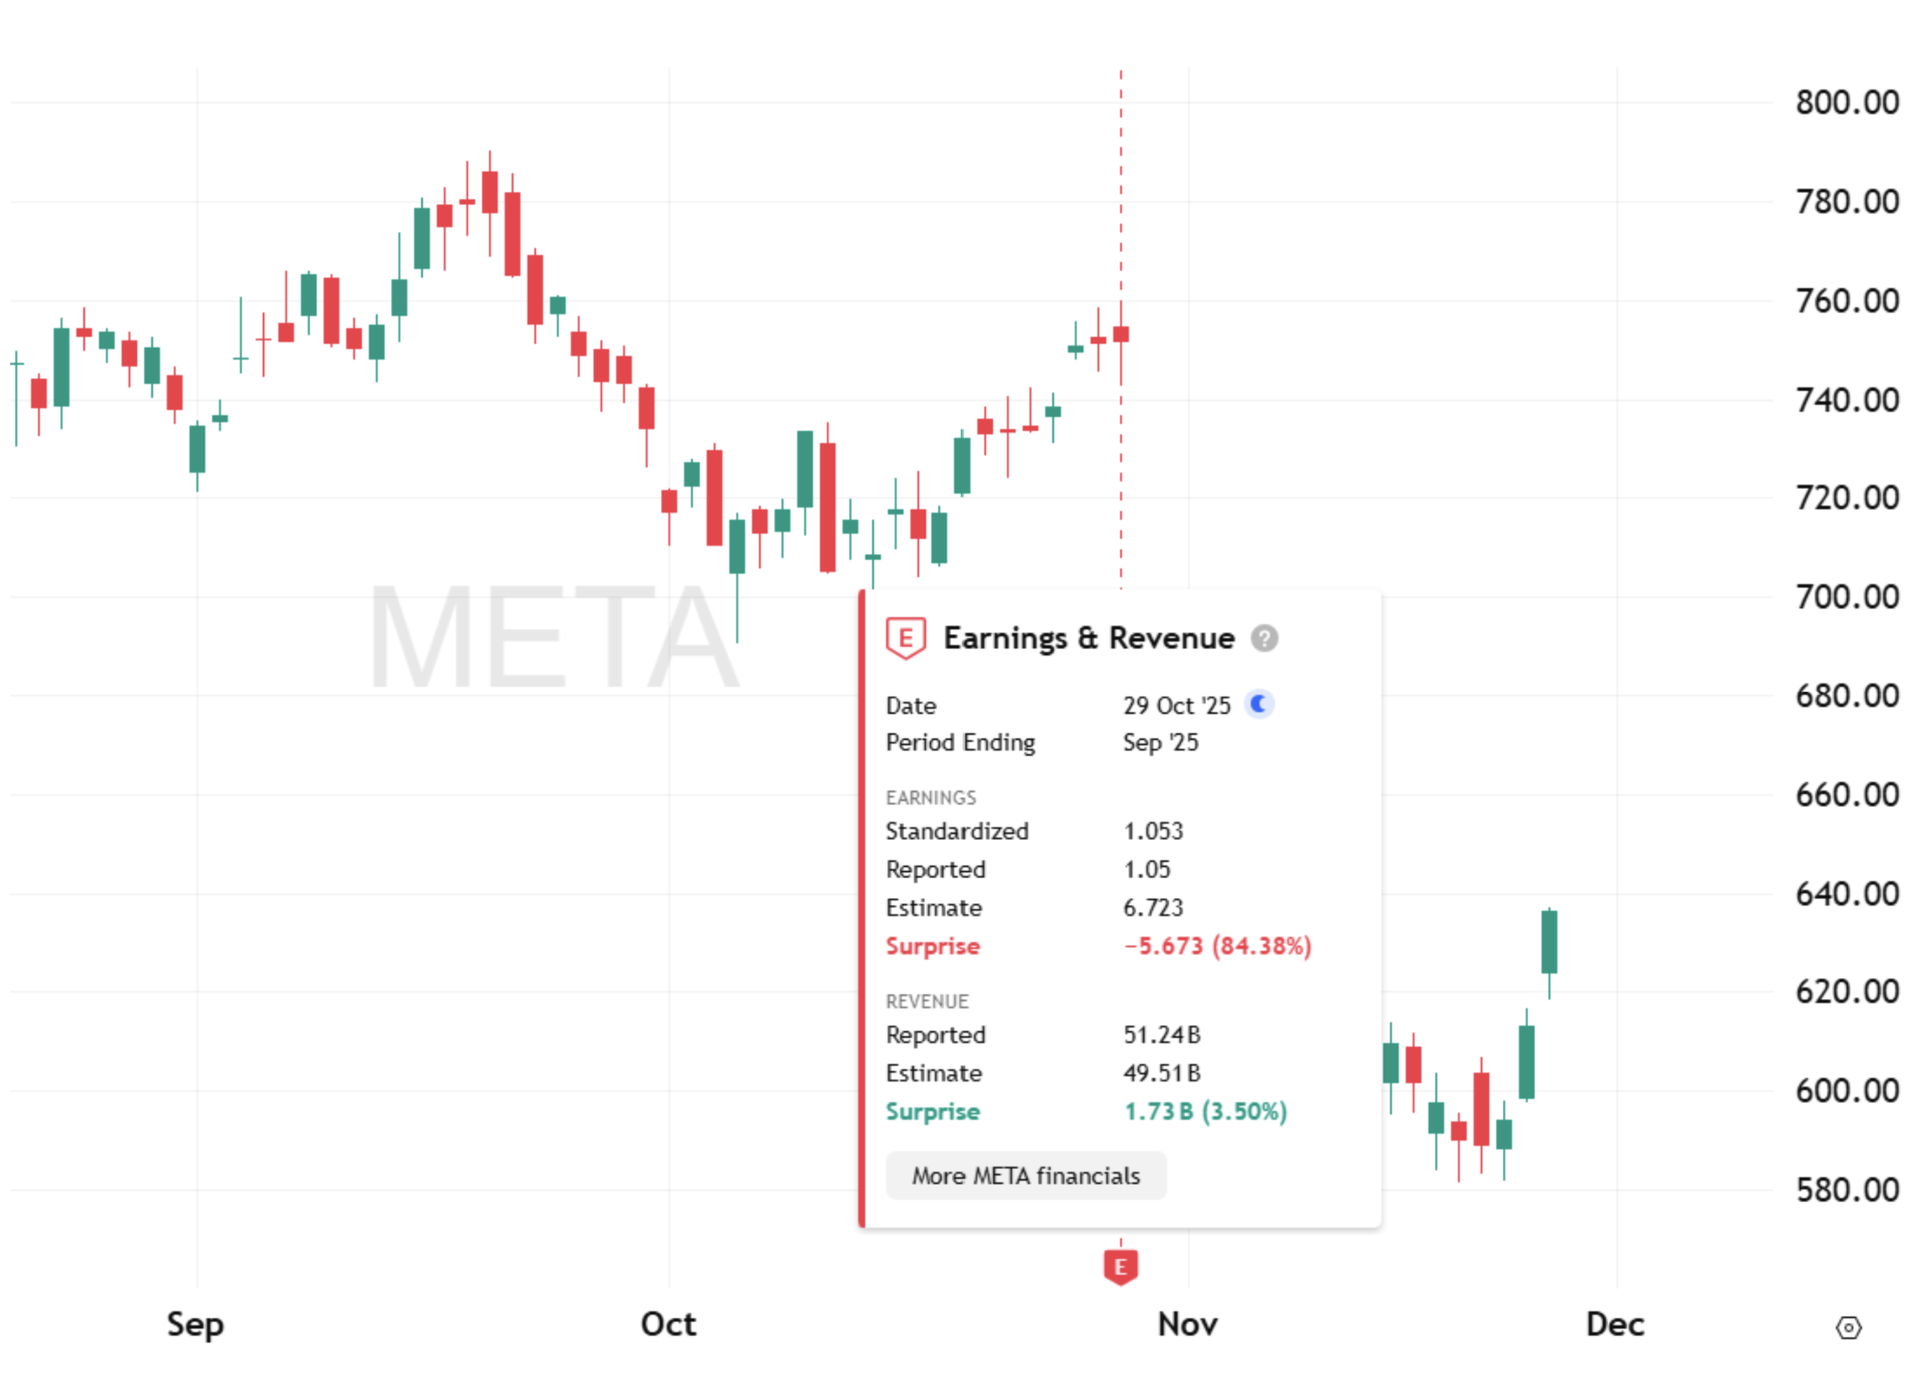
Apparently that move is at least a little meaningful because when Meta announced they would buy Google’s AI chips instead of Nvidia’s, NVDA tumbled in pre-market trading, while META gapped up on the news. That said, the market is far from forgiving the 20 percent discount it handed METAs shares after the unpleasant surprise the company delivered. Meanwhile Nvidia is giving a golf clap to those taking this route, insisting they are already a generation ahead. Drama ahead, grab the popcorn!

Are There Really 2000 Pips to be Had in this Trade?
If you happened to have had one of those dire-warnings-about-the-BOJ videos hit your YouTube or Instagram feed lately, rest assured, you are not alone. The algos have begun serving up this theme and, to be fair, it isn’t without merit to discuss the unwinding of the carry trade.
And while it may be a bit hyperbolic to project the longer term ramifications of this trend, there is another reality to consider. It is ridiculously fun!

Normally I don’t consider chart patterns as a highly productive way to anticipate trades worth considering. Primarily because chart patterns are notorious for not showing a predictive edge. They do, however, make great planning tools when you come across a larger trend and you need to make a plan for how much to risk if you want to take advantage of it.
The chart above shows a descending wedge pattern in the price action on the weekly chart. This pattern is commonly considered to portend a bullish breakout, and provide a forecast for continuing the original trend to an extent that is equal or greater than the first move higher in the pattern. That is how we arrive at the possibility of a 2000 pip move further on the USDJPY currency pair.
Such a move might take as much as six months to play out and would have a very significant ripple effect around the world. What are the changes it will happen? I’d give it a 36% chance. That’s the average win rate for almost all trailing stop trends, and this forecasted move would certainly qualify for that strategy.
But like the other two charts above it, this trade signifies an important reality: there are many opportunities nowadays for the right investors – those not shying away from taking risk.


Gordon Scott, CMT is a former managing director of the CMT Association and a current member of the Investopedia Financial Review board. He has over 20 years of experience as a coach and trader in securities, futures, forex, and penny stocks. He is a co-founder of Edge Finder. Learn more at https://myedgefinder.com/.
Shared content and posted charts are intended to be used for informational and educational purposes only. CMT Association does not offer, and this information shall not be understood or construed as, financial advice or investment recommendations. The information provided is not a substitute for advice from an investment professional. CMT Association does not accept liability for any financial loss or damage our audience may incur.
