Bull Markets Climb a Wall of Worry
Since April, the markets have defied the expectations of pundits and professionals alike. Options were priced for much more downside than we observed over the following months, and even Berkshire Hathaway increased its cash position. But the anticipated market crash just didn’t show up.
Investors of all types still appear to be nervous about the future, and yet the way market performance has unfolded seems to reinforce an old saying that bull markets will climb a “wall of worry.” (I know some traders prefer to repeat the saying that bull markets go up the stairs and a bear jumps out the window, but either maxim works here). Despite all rationale to the contrary, investors have placed the majority of their money in sectors where they appear exposed to the most risk.

This table, courtesy of stockcharts.com, shows that over the past six months, the top four sectors out of those eleven tracked by State Street’s convenient sector ETFs (each with a ticker that starts “XL”), are sectors where the technology and growth companies are likely to be found.
Sector Rotation Without Breadth
Looking at a comparative performance chart over that time period, you can see something interesting. Not only are those four above the broader market average as tracked by SPY, but they are the ONLY four. The other seven are lagging behind SPY—and not just by a little.
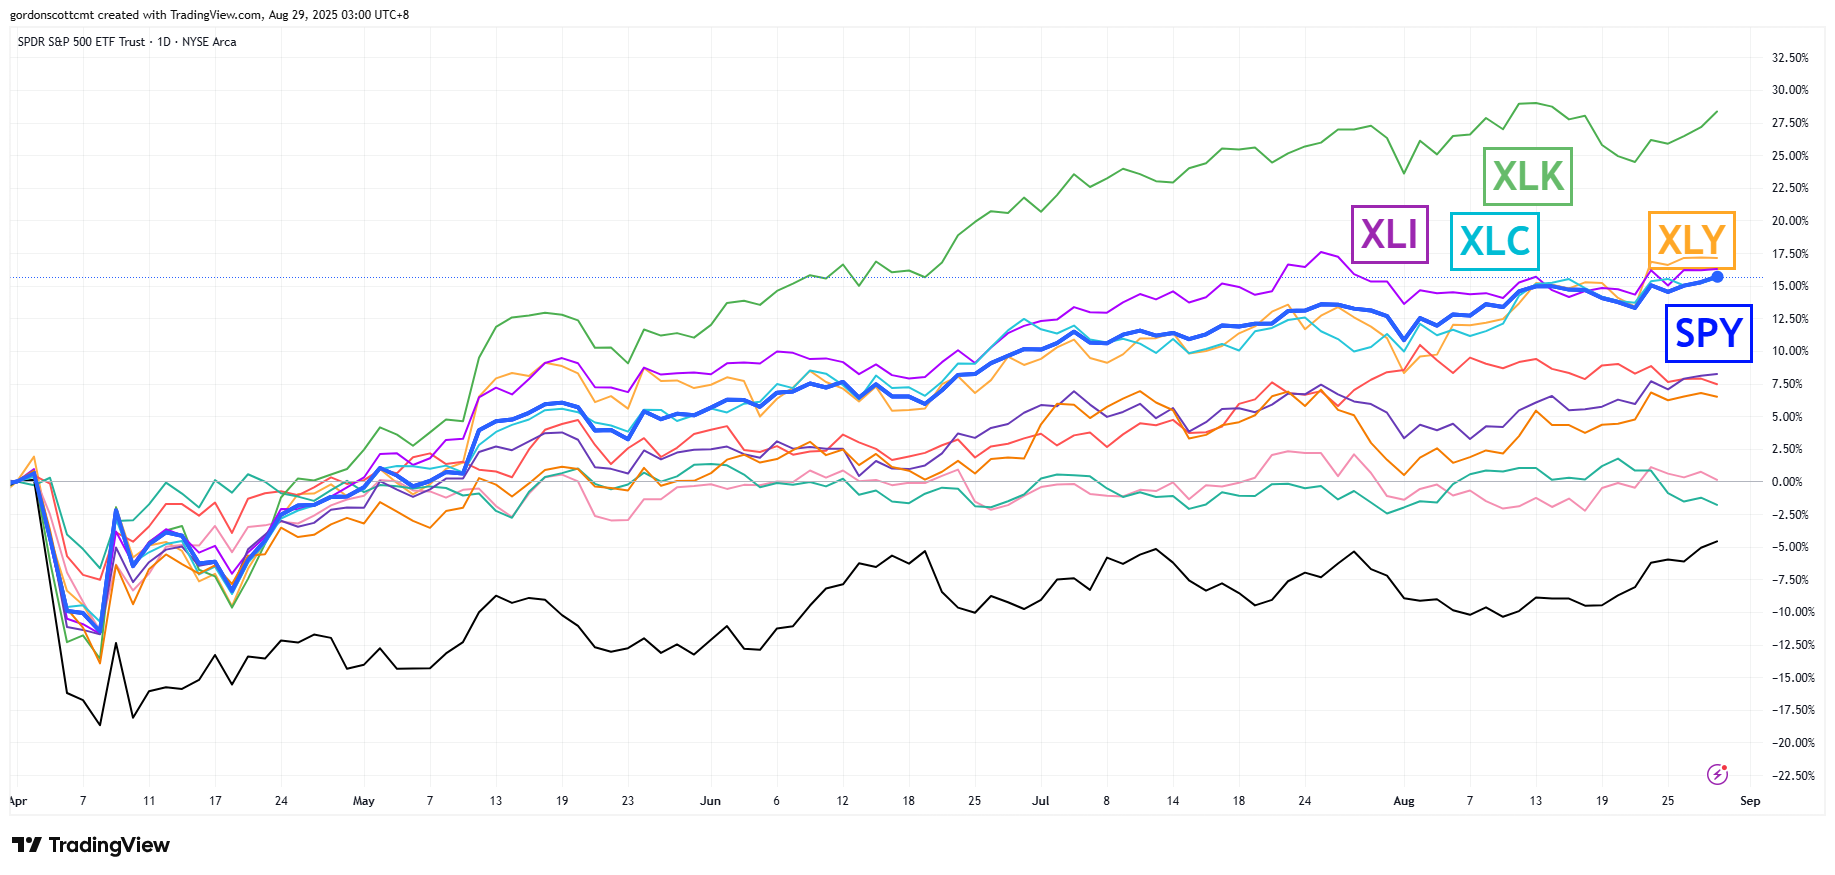
The clear separation between the top four sectors and the bottom seven may give some technicians a reason to worry that the current bull market isn’t strong enough to continue. However, there is something more to consider here, namely, the which point of the market and economic cycle we may be in right now.
What Happens Early in Bullish Cycles
A theoretical market that has stood the test of time was created years ago by Sam Stoval and published in his book “Standard & Poor’s Sector Investing: How to Buy the Right Stock in The Right Industry at The Right Time.” Though the book was published almost 30 years ago, readers find this book has held its value over time. Consider that it’s cover price was $24.95 with the fact that a used copy must be purchased on Amazon for $59.95.
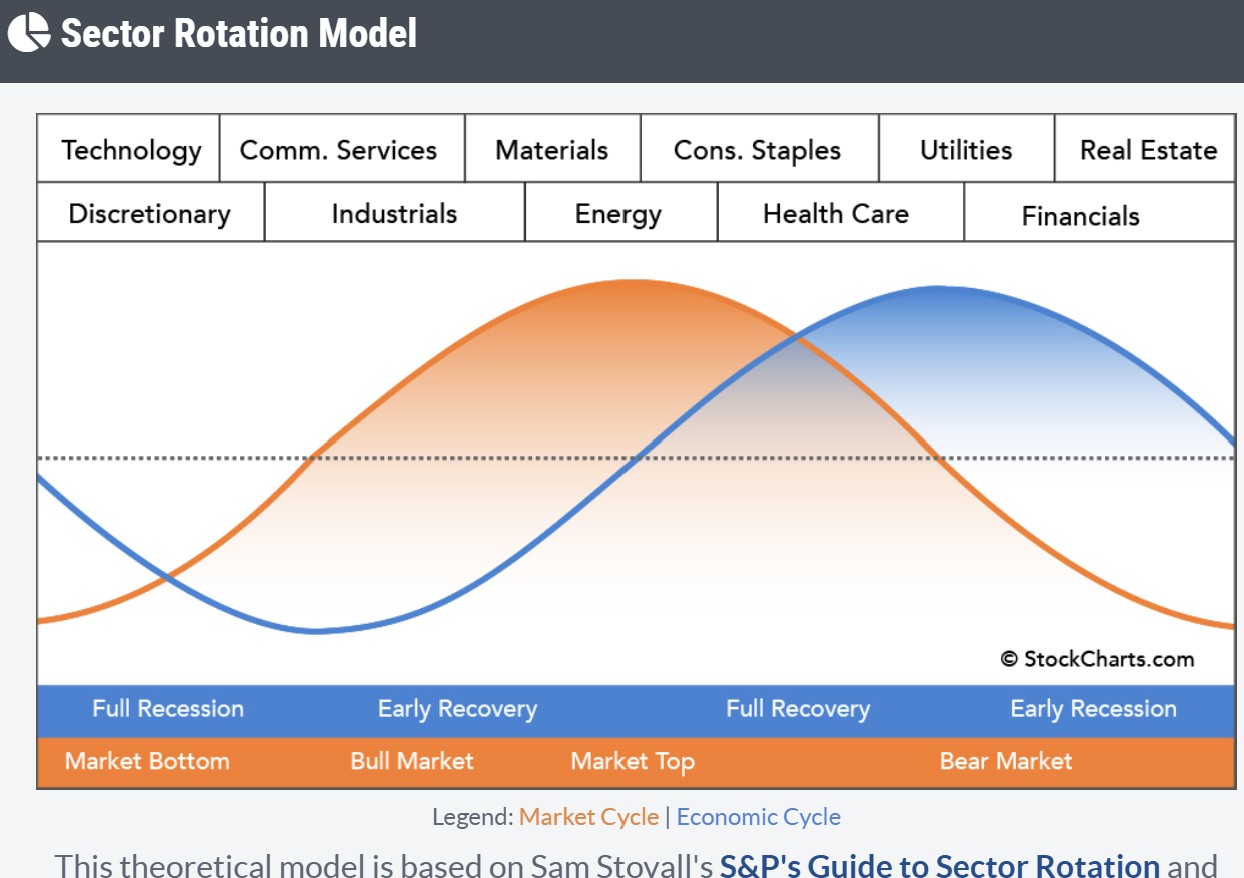
The model isn’t perfectly applicable to a day-by-day market reading, but it often holds up well in hindsight when comparing sector movements with market and economic cycles. Which leads us to where we are right now. This model clearly describes that when Technology, Industrial, Communication Services, and Discretionary sectors are most likely to be doing well at the same time, is coincident with the early stages of a bullish market cycle.
It is one thing to be bold enough to say investors don’t really need to be worried about tariffs, but it is a next level of bold to claim that we are, right now, at the beginning of a multi-year bullish market cycle. Yet that is what Mr. Stovall’s model proclaims is unfolding right now.
Shared content and posted charts are intended to be used for informational and educational purposes only. CMT Association does not offer, and this information shall not be understood or construed as, financial advice or investment recommendations. The information provided is not a substitute for advice from an investment professional. CMT Association does not accept liability for any financial loss or damage our audience may incur.
