Investopedia is partnering with CMT Association on this newsletter. The contents of this newsletter are for informational and educational purposes only, however, and do not constitute investing advice. The guest authors, which may sell research to investors, and may trade or hold positions in securities mentioned herein do not represent the views of CMT Association or Investopedia. Please consult a financial advisor for investment recommendations and services
S&P 500
A bull market is usually marked by an expansion in new 52-week highs. Because if there aren’t enough stocks participating in a new uptrend phase, then we have to question the sustainability of the move as it represents stalled demand. A quick review of this breadth indicator shows that there are indeed plenty of stocks participating in the current uptrend.
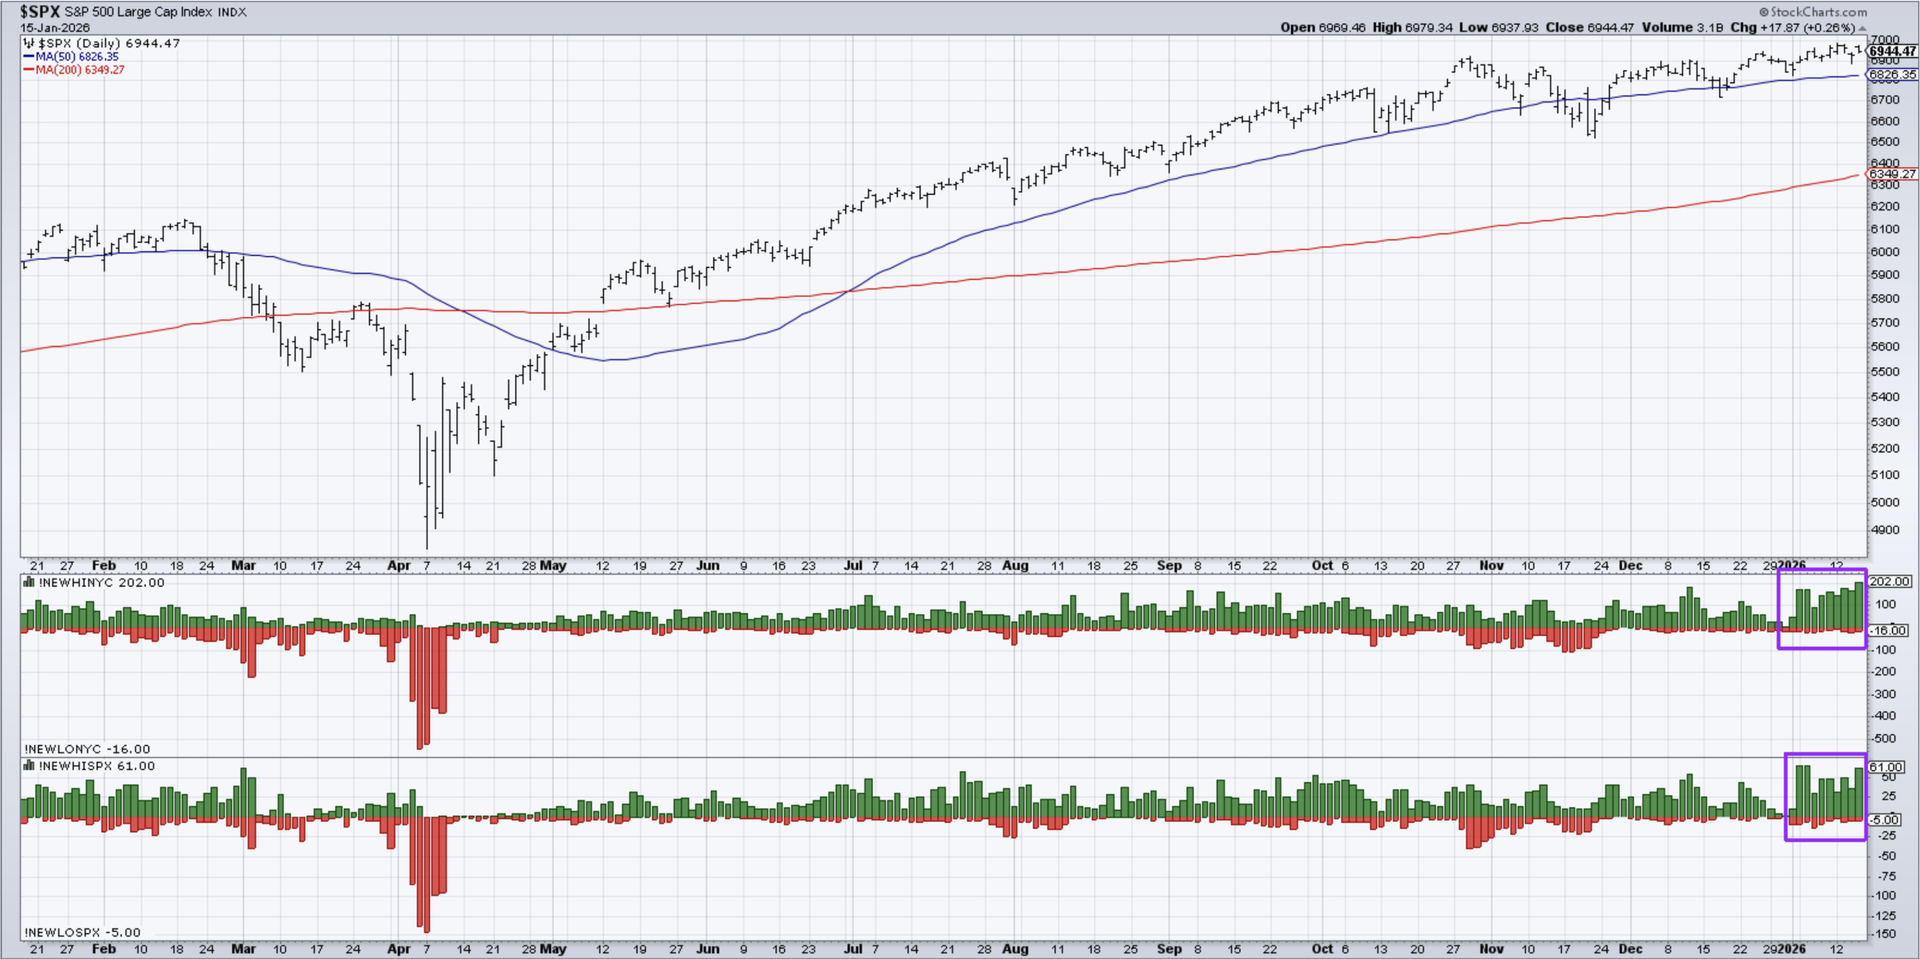
Just over 12% of the S&P 500 members made a new 52-week on Thursday of this week, as did over 200 stocks listed on the NYSE. In fact, most trading days so far in January have seen 10-12% of the S&P 500 stocks hitting a new 52-week high. Bulls should be looking for this reading to steadily increase, as more and more names achieve their own new high and provide further upside pressure for the SPX.
Alphabet
Shares of Alphabet (GOOGL) pulled back on Thursday, bringing the stock’s RSI out of the overbought region. This pattern has occurred five other times since the April market low, and we can see this RSI signal has usually led to a quick retest of moving average support.
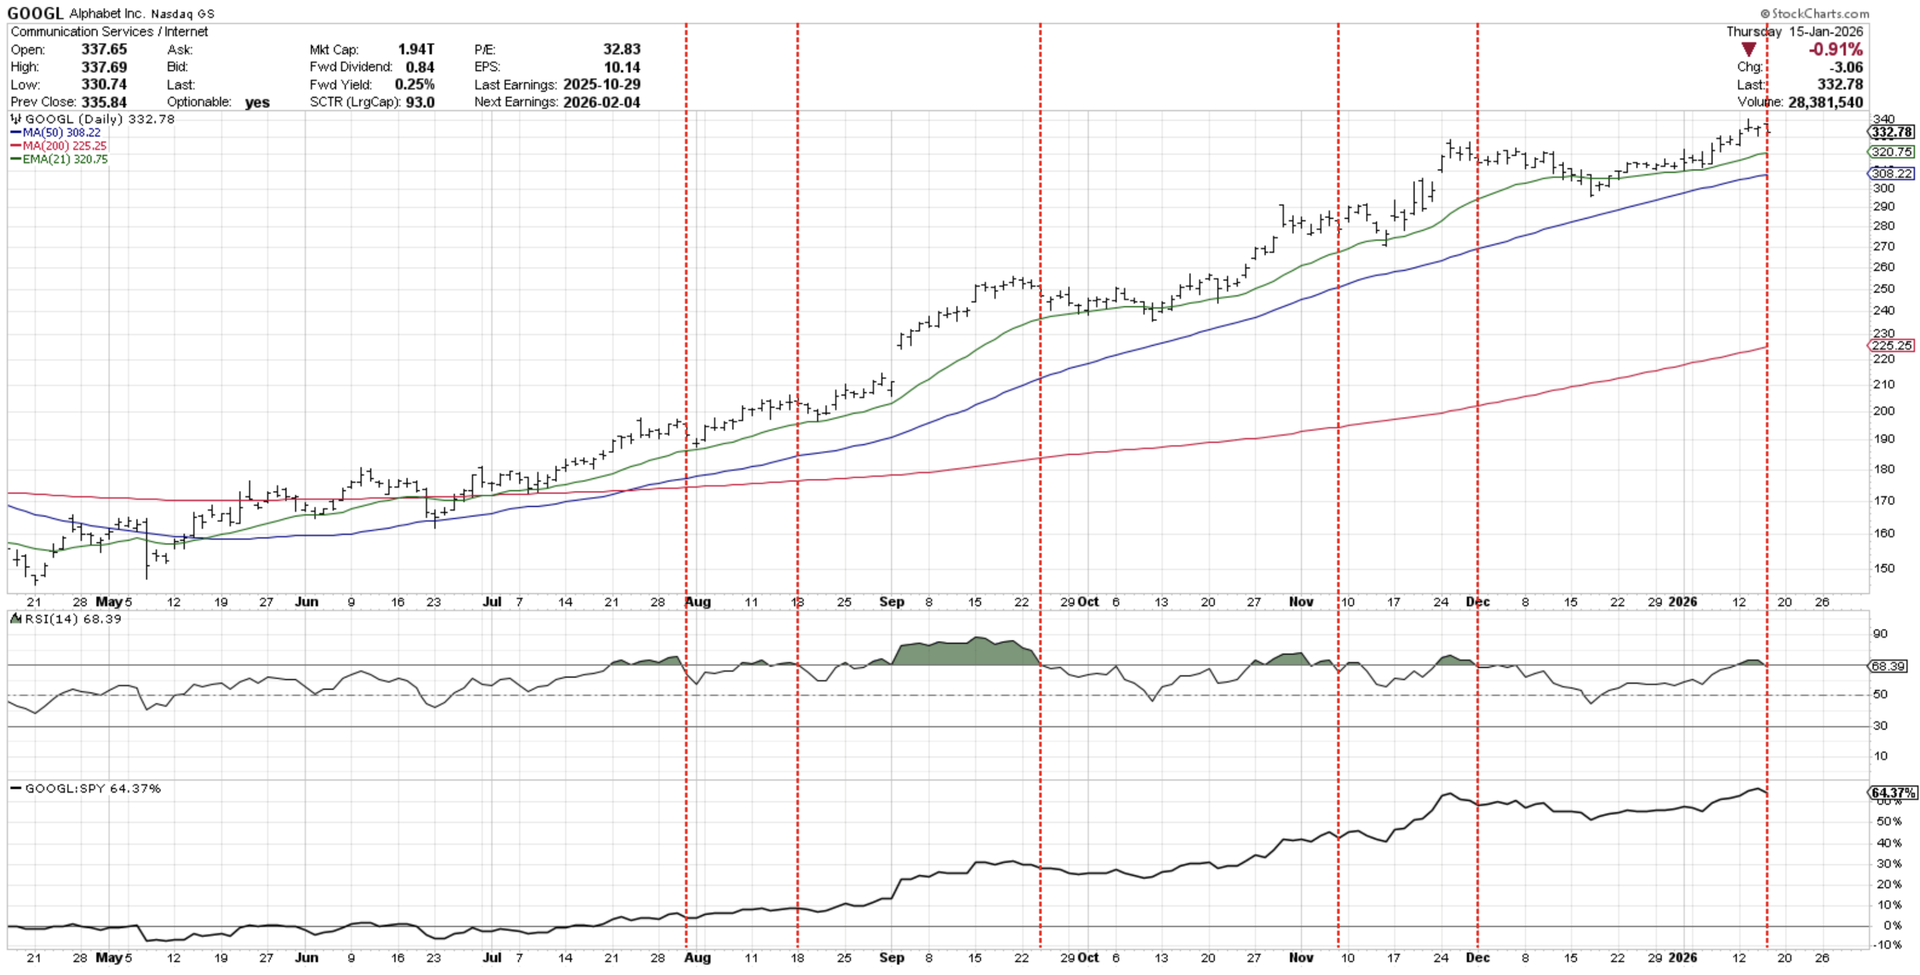
To be clear, a stock becoming overbought is not necessarily a bad thing. In fact, stocks often become overbought in the early stages of a bull market phase, as a strong influx in demand pops the RSI to extreme levels. As I like to summarize, “Overbought means up a lot.”
Now when the RSI comes out of the overbought region, even if the long-term uptrend is still in great shape, we may just be seeing a natural short-term corrective move within the context of the long-term uptrend. For GOOGL, previous pullbacks during this uptrend phase have resulted in a pullback to the 21-day exponential moving average. Patient investors may be rewarded with a more ideal entry point in the days to come.

Morgan Stanley
While a number of banks pulled back this week after disappointing earnings, Morgan Stanley (MS) pushed on to achieve a new all-time high on Thursday. With weaker momentum supporting this latest thrust higher, the chart now features a bearish momentum divergence.
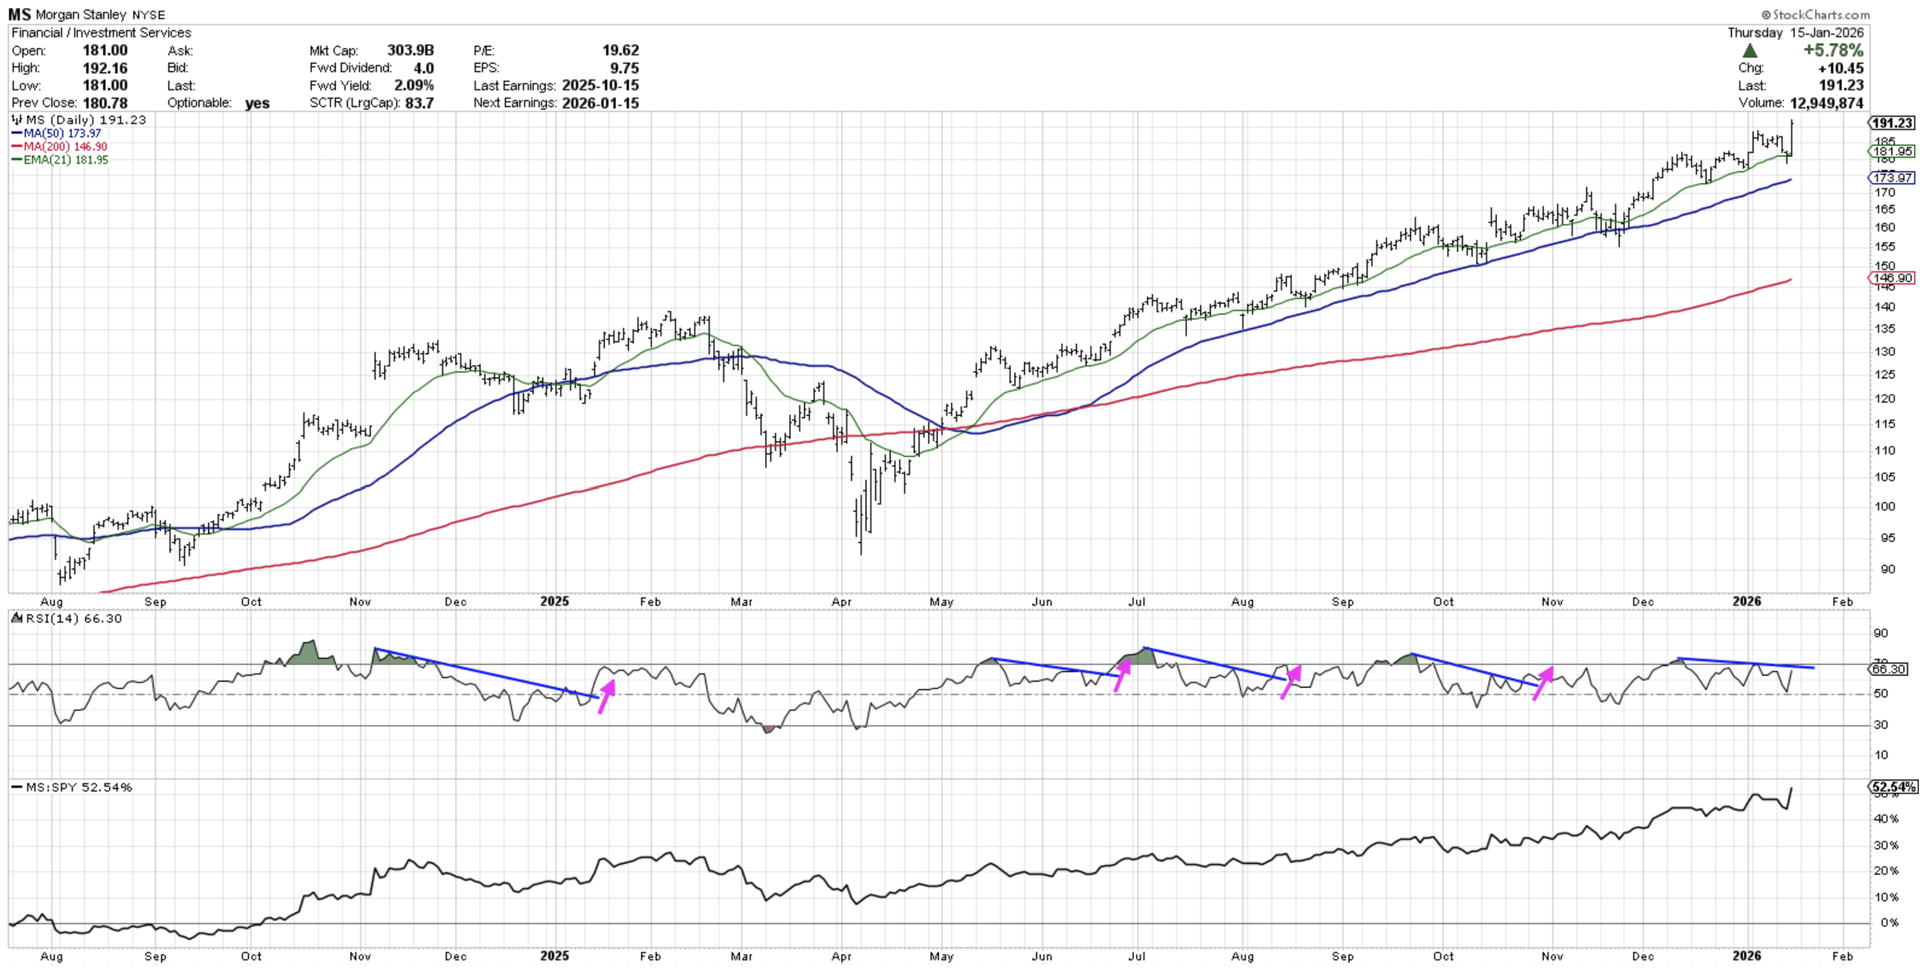
There are two ways that a chart can alleviate a bearish momentum divergence. Either the price drops, confirming the bearish divergence as the stock fails on weaker demand, or the price rallies on strong momentum to negate the divergence. Morgan Stanley has often demonstrated the latter, where an initial short-term pullback is soon met with new buyers.
If we do see stronger momentum going into next week, that would represent yet another example where a potential warning sign turns into a continuation signal for this investment banking giant. And as long as MS keeps pounding out a pattern of higher highs and higher lows, the trend is our friend!

David Keller, CMT is a past president of the CMT Association, a CNBC Contributor, and President and Chief Strategist at Sierra Alpha Research. Dave recaps market activity and interviews leading experts on his “Market Misbehavior” YouTube channel. He has served as Managing Director of Research at Fidelity Investments, Chief Market Strategist at StockCharts, and Application Specialist at Bloomberg.
Shared content and posted charts are intended to be used for informational and educational purposes only. CMT Association does not offer, and this information shall not be understood or construed as, financial advice or investment recommendations. The information provided is not a substitute for advice from an investment professional. CMT Association does not accept liability for any financial loss or damage our audience may incur.
