Investopedia is partnering with CMT Association on this newsletter. The contents of this newsletter are for informational and educational purposes only, however, and do not constitute investing advice. The guest authors, which may sell research to investors, and may trade or hold positions in securities mentioned herein do not represent the views of CMT Association or Investopedia. Please consult a financial advisor for investment recommendations and services
You may suggest a subject line to your email send here (optional).
S&P 500: Naughty or Nice?
S&P 500 Monthly Chart
S&P 500 Weekly Chart
S&P 500 Daily Chart
S&P 500: Naughty or Nice?
During the past week, I have done my best impression of Santa Claus by reviewing various energy and metals commodity charts to decide if they will be put on the naughty or nice list. I am sure that Jolly Old Saint Nicholas has his elves put all children on the nice list, at least initially. Therefore, we have done the same for the markets I reviewed. However, should those markets display some bad behavior, then we will all know when to move them to the naughty list as their trends weaken or change.
In my last article of the week, I am switching my focus to equity markets, specifically, the S&P 500 Index. The S&P 500 has been displaying some naughty behavior and formed bearish patterns and signals that could land it on the naughty list ahead of the big day and into the new year.
Below are some of the recent technical factors used to determine the ‘naughty’ or ‘nice’ outlook for the next few weeks. Of all the markets covered this week, the S&P 500 Index has the best chance of being put on the ‘naughty list’ within the next few weeks.
Nice (Bullish)
- All major prior swing lows have held
- Trading above major trendlines
- Monthly and weekly Kase Trend are bullish
- Daily Kase Trend is weak bullish
- Held the:
- 21 percent retracement of the rise from $4385.04
- 50 percent retracement of the rise from $6521.92
- Recaptured the 50-day moving average
Naughty (Bearish)
- Monthly dragonfly doji (or hanging man)
- Double top around $6920.34 high
- Confirmation point: $6521.92
- Target: $6106.62
- Monthly KasePO, KaseCD, and MACD divergences
- Weekly and daily KasePO and RSI divergences
- Monthly RSI and Stochastic are overbought
- Weekly Stochastic overbought signal
- Daily Stochastic overbought signal
- Sustained close below the 20-day moving average
- Held the 38 percent retracement of the decline from $6903.46
- 14-day DMI bearish crossover, ADX is below 25 and falling
S&P 500 Monthly Chart
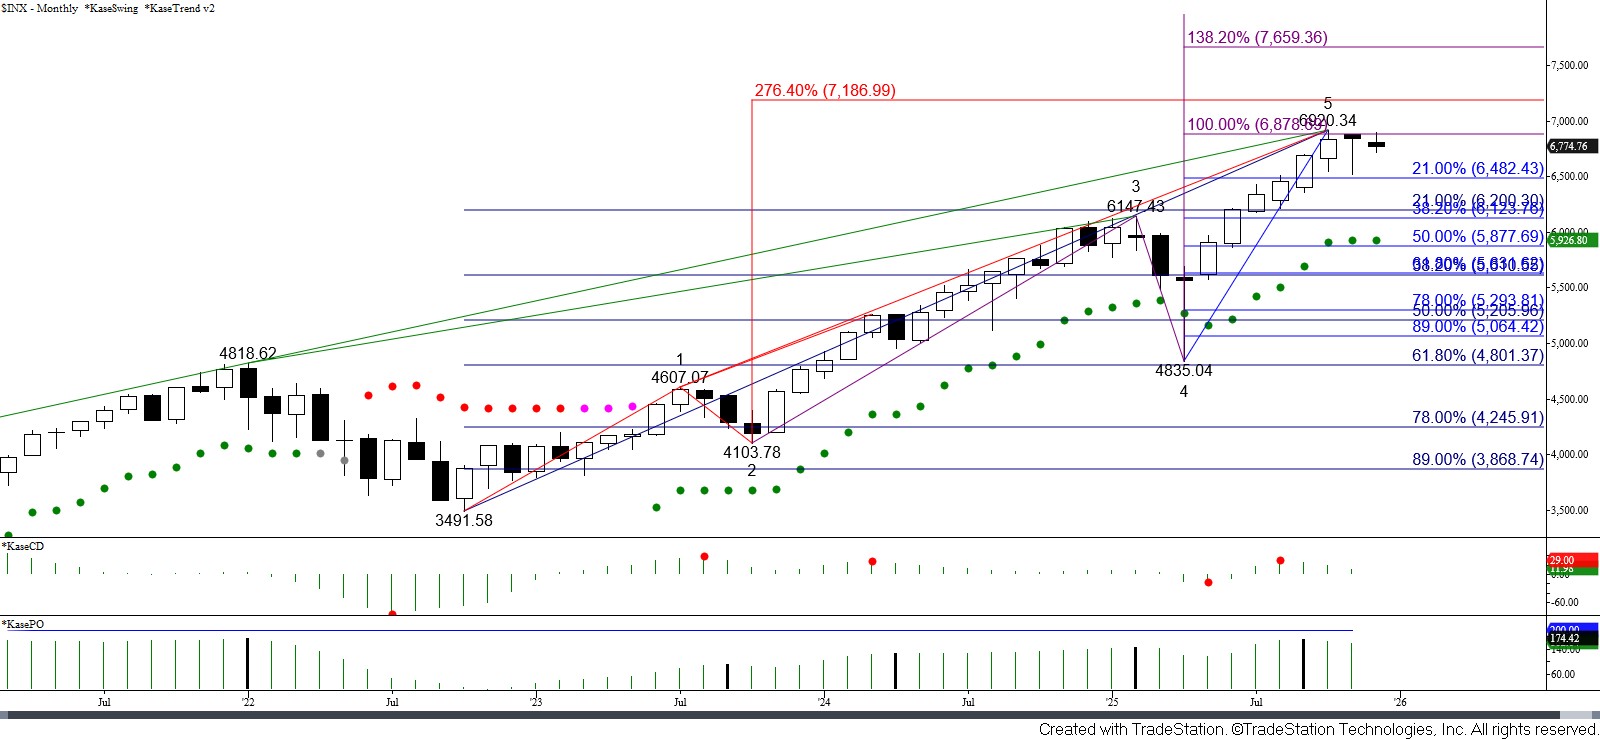
The S&P 500 Index put itself on the ‘naughty list’ for a few months earlier this year when prices fell from the February high of $6147.43 to the April low of $4835. However, the index cleaned up its act and rose to new highs, reaching $6920.34 in October.

https://www.kaseco.com/wp-content/uploads/2025/12/SP500-Monthly.jpg
- Note that the $4835.04 swing low was in line with the prior major high of $4818.62. This was resistance that became support, and we may see a similar move to test the $6147.43 swing high, should the S&P 500 be placed on the ‘naughty list’ within the next few weeks.
- The $6290.34 high may have ended a five-wave trend up from $3491.58, where Waves 3 and 5 were equal. Additionally, the S&P 500 began to act up again in November when a monthly dragonfly doji formed. Some might classify this as a hanging man because the body may be a bit big to be a doji. Either way, this candlestick reversal pattern indicates that the bulls could not keep firm control. Monthly bearish KasePO, KaseCD, and MACD divergences were also confirmed by November’s pullback, and the monthly RSI and Stochastic are overbought. These bearish factors warn that a significant downturn might occur.
S&P 500 Weekly Chart
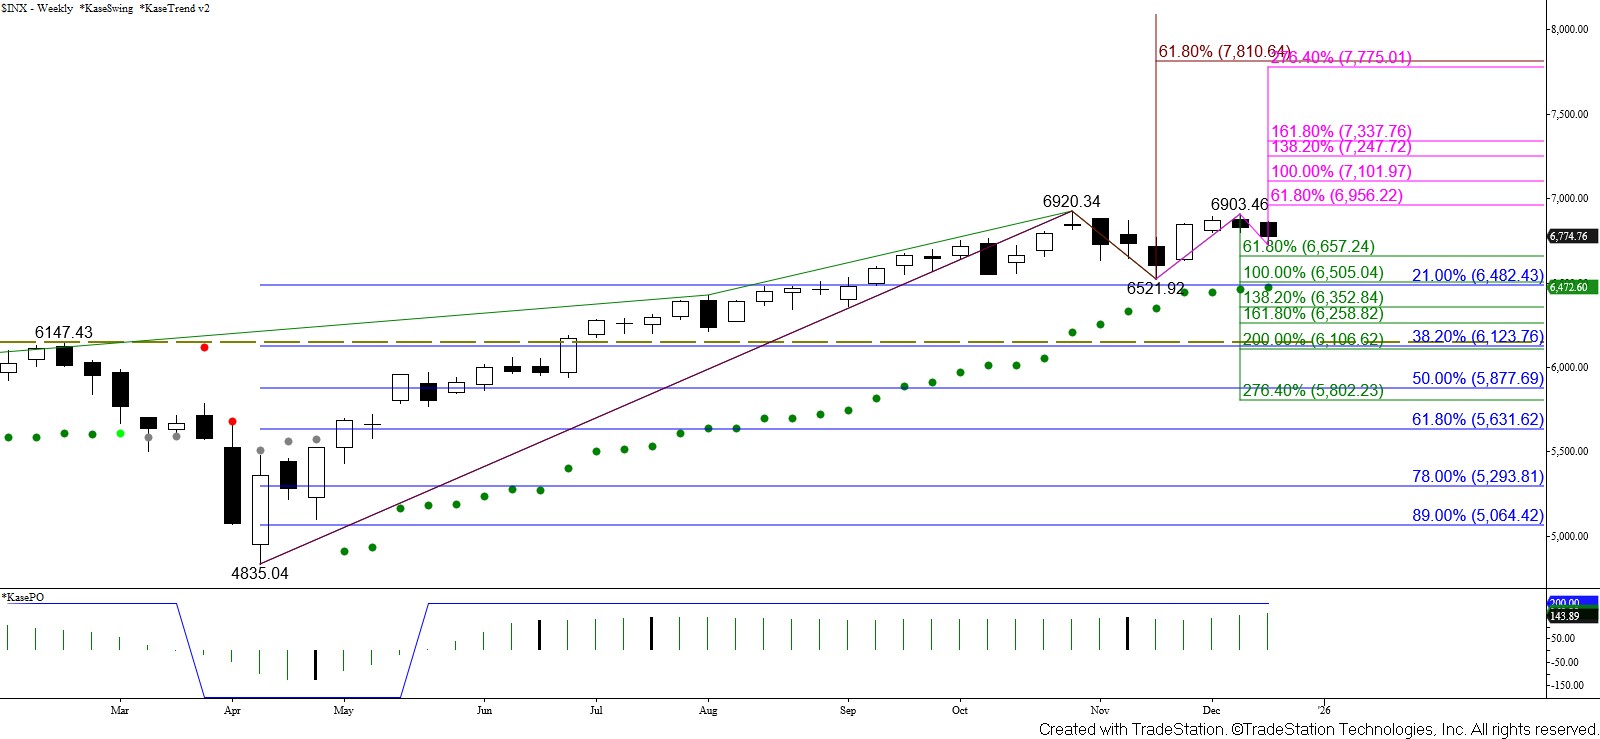
The weekly chart also confirmed bearish KasePO and RSI divergences at the $6920.34 high. More importantly, a double top between the $6920.34 and $6903.46 swing highs formed. This reversal pattern is significant for the outlook in the coming weeks. The $6501 level is key because it is in line with the $6521.92 confirmation point of the double top, the equal to (1.00) target of the wave down from $6920.34 (green), the 21 percent retracement of the rise from $4835.04 (blue), and the weekly Kase Trend bearish threshold (green dot). Closing below $6501 will confirm the double top and the monthly dragonfly doji, placing the S&P 500 Index on the ‘naughty list’ for at least a few weeks and perhaps longer.

https://www.kaseco.com/wp-content/uploads/2025/12/SP500-Weekly.jpg
The target of the double top is $6125 (green). This is also the 38 percent retracement of the rise from $4835.04 (blue). It is interesting to note that support at $6125 is near the $6147.43 swing high. Therefore, like the pullback that occurred earlier this year and bottomed out in April, should the S&P 500 confirm the double top by settling below $6501, look for significant support at $6125.
S&P 500 Daily Chart
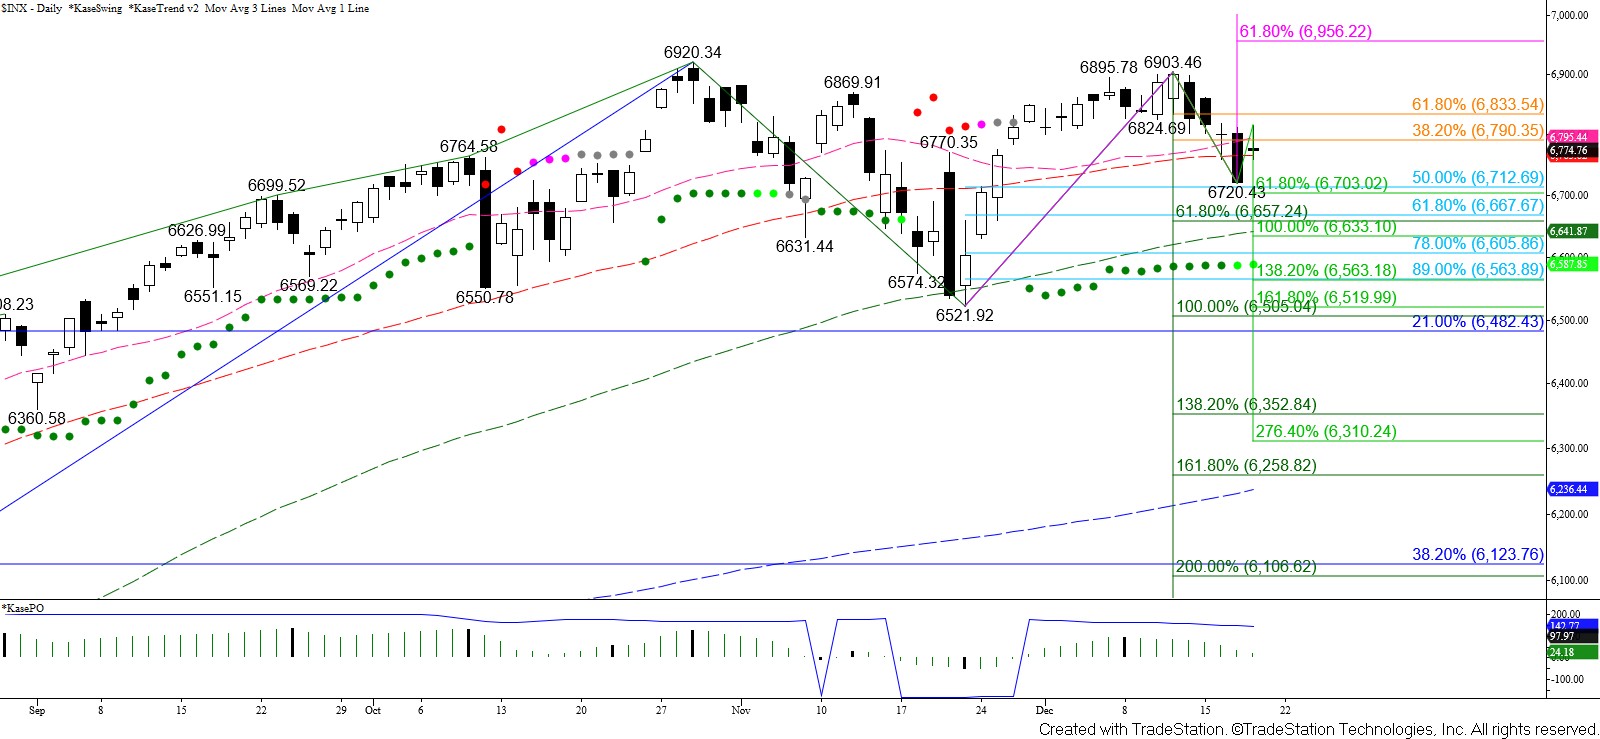
Up to this point, we have been focused on the recent ‘naughty’ behavior of the S&P 500 Index. However, it is premature to place the index on the ‘naughty list’. The index could clean up its behavior and showed early signs of trying to do so on Thursday when it recaptured the 50-day moving average. Additionally, the 50 percent retracement of the rise from $6521.92 has held, and the index is still trading above the $6651 smaller than (0.618) target of the wave down from $6290.34 (green). This support level is in line with the 62 percent retracement from $6521.92 and the 100-day moving average. Closing below $6651 would increase the odds for a test of the ‘naughty list’ threshold at $6501.

https://www.kaseco.com/wp-content/uploads/2025/12/SP500-Daily.jpg
Although there are a lot of bearish patterns and signals that warn a reversal might be underway, the monthly dragonfly doji and the double top have not been confirmed. Most technical trend measures also indicate that the uptrend is still intact. Therefore, I am not ready to give up on the S&P 500 Index because today’s close back above the 50-day moving average suggests that it is trying to remain on the ‘nice list’.
Settling above $6834, the 62 percent retracement of the decline from $6903.46 (orange), would suggest that the pullback from $6903.46 is complete. In this case, look for another test and attempt to overcome the $6920 double top to negate this pattern. Closing above $6940, which sits between the $6920 double top and the $6956 smaller than (0.618) target of the current wave up from $6521.95 (magenta) would confirm a bullish outlook, opening the way for the next major uptrend targets at $7187, $7659, and $7791.
It has been a pleasure sharing my analysis with you this week. I wish you a happy holiday season and a wonderful New Year!

Dean Rogers, CMT, has been a member of the CMT Association for 17 years. He has over 25 years of experience as a technical analyst specializing in trading indicators and systems development, writing award-winning forecasts for the energy and metals commodity markets, and creating hedging and risk management strategies. Dean is the President of Kase and Company, Inc.

Shared content and posted charts are intended to be used for informational and educational purposes only. CMT Association does not offer, and this information shall not be understood or construed as, financial advice or investment recommendations. The information provided is not a substitute for advice from an investment professional. CMT Association does not accept liability for any financial loss or damage our audience may incur.
