| Investopedia is partnering with CMT Association on this newsletter. The contents of this newsletter are for informational and educational purposes only, however, and do not constitute investing advice. The guest authors, which may sell research to investors, and may trade or hold positions in securities mentioned herein do not represent the views of CMT Association or Investopedia. Please consult a financial advisor for investment recommendations and services. |
SPY Basing at $675 20DMA After Volatile Sell-Off
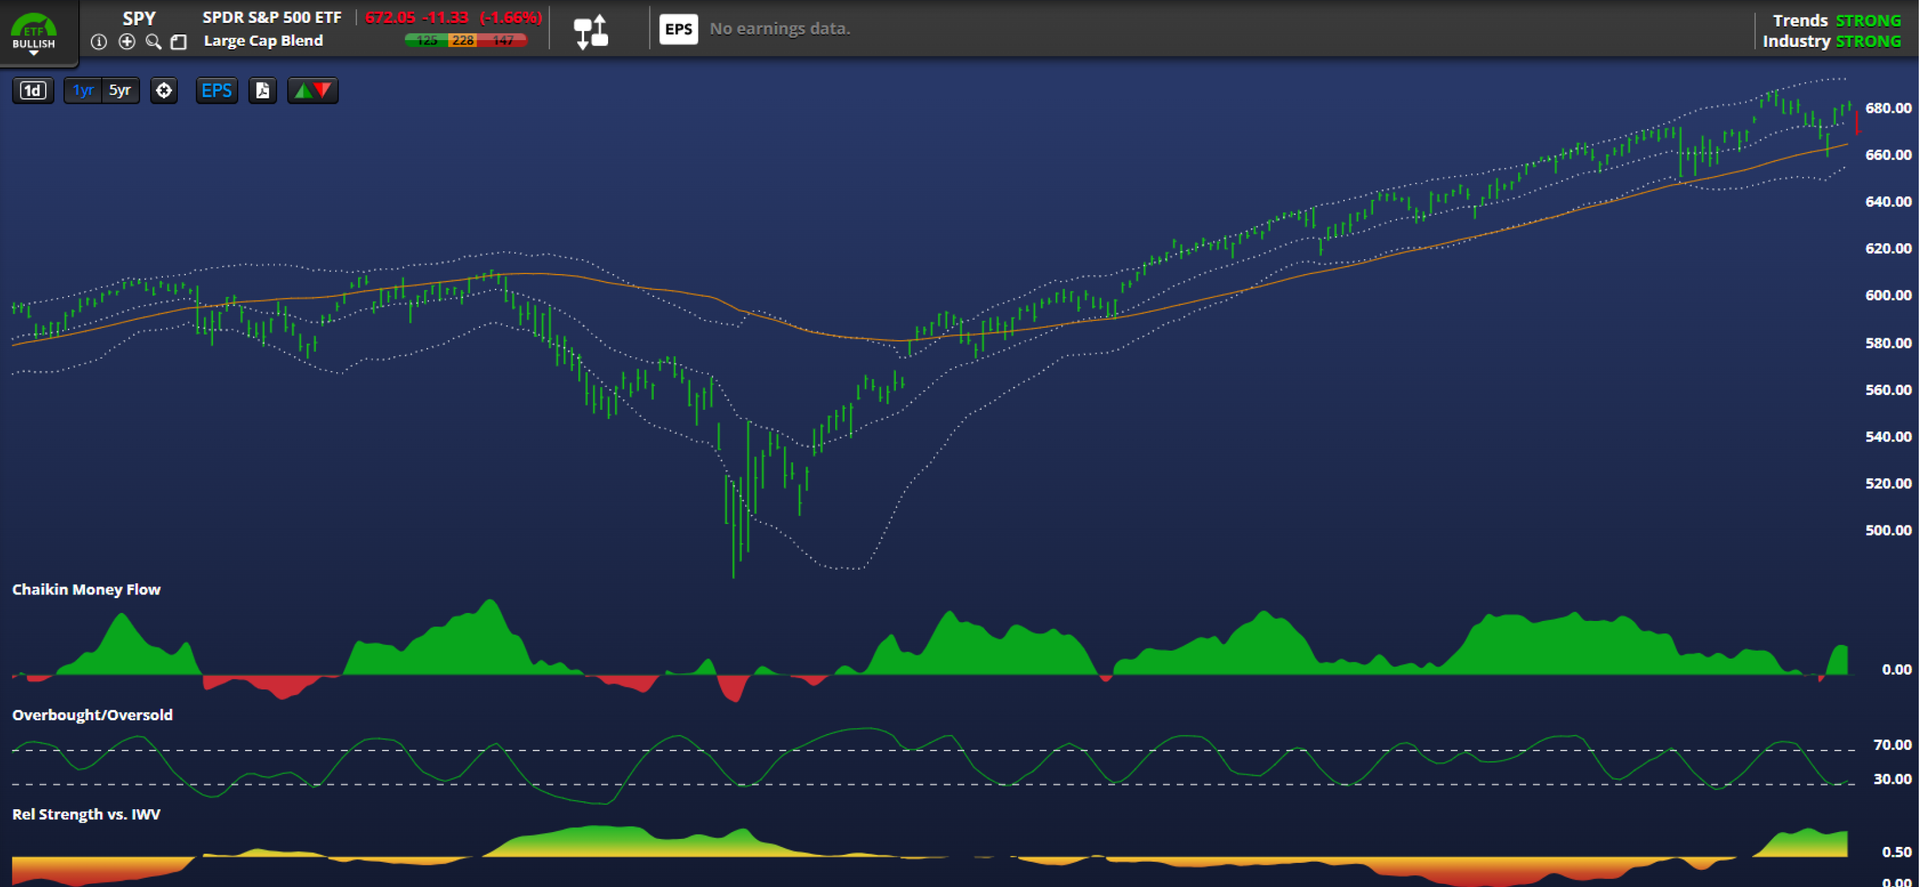
Wrapping up the week’s sessions, we look at the S&P 500 ETF (SPY), which was down a sizable 1.5% on Thursday’s trading—a move multiple standard deviations from the mean. Despite this recent pressure, the market has been on an absolute tear since decisively closing above its rising 200-day moving average in mid-May. This breakout led to overbought characteristics in July, again in September, and a push to the all-time high of $690 on October 29th.
The market’s deep structural resilience was first established during the tariff volatility scare from March 10th to May 9th. During that period, SPY temporarily traded beneath its rising 200-day moving average, with the ultimate bottom found on April 7th at $482. Since recovering from that low, SPY has consistently traded above the 41 RSI level since late April, confirming strong momentum and sustained institutional participation in money flow.
Even with Thursday’s sharp sell-off, the current price action suggests SPY is basing around the $675 level, which coincides with the critical 21-day exponential moving average support zone. This consolidation offers a strategic entry point for traders positioning for the next leg up. The bullish target for late November/early December is $692, a 3% rally which would propel the market to new all-time highs.
IBIT Testing $55 Support After 200DMA Breakdown
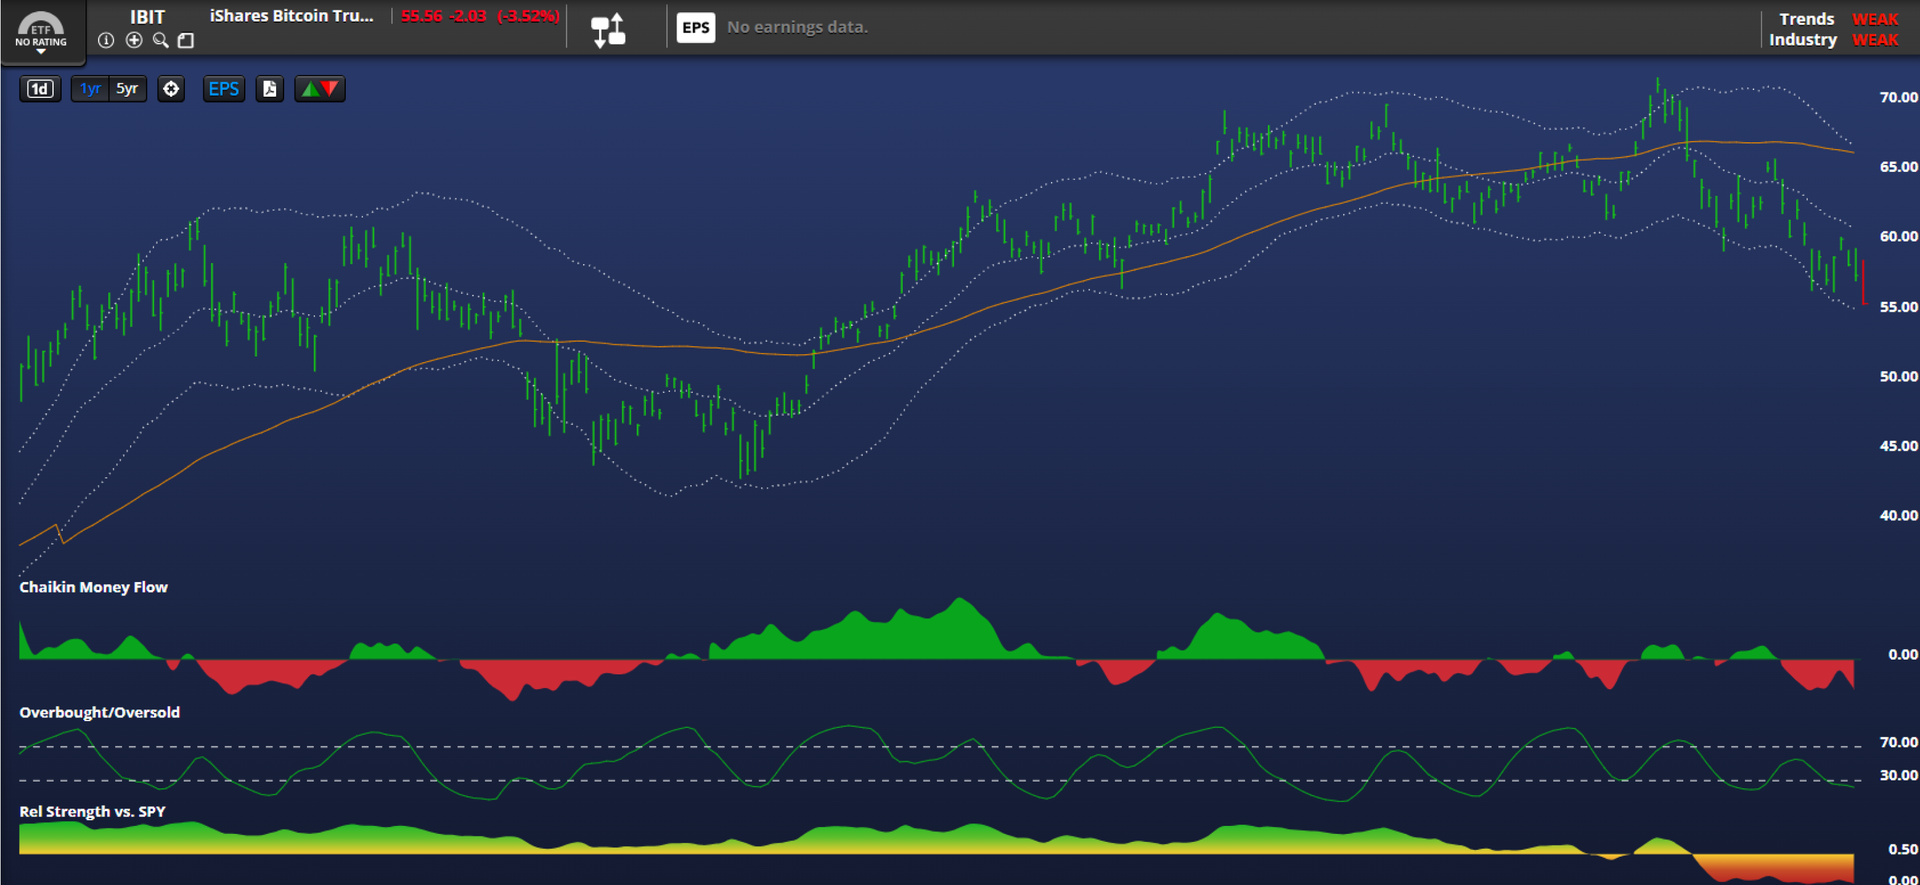
The iShares Bitcoin Trust ETF (IBIT) presents one of the year’s most compelling—yet concerning—charts, having recently broken its long-term bullish structure. The 52-week low coincided with the broader market bottom on April 7th at $43, leading to an all-time high of nearly $72 on October 6th. During the initial bullish run, IBIT traded beneath a 50 RSI from early February through mid-April, all while maintaining support above its rising 200-day moving average (DMA).
However, the structural integrity of the trend was challenged when IBIT fell below the 200DMA on November 4th, which now stands at $59 and is beginning to decline slightly. The crypto space has been exceptionally weak, with IBIT trading at six-month lows and the RSI not closing above 52 since the week of its all-time high, confirming the lack of recent momentum. It is important to note the bearish divergence signaled at the all-time high, where the RSI barely reached 68, foreshadowing the current consolidation.
While IBIT is lower and weaker than anticipated, its historic resilience (it has not been oversold all year) warrants a longer leash. We expect the $55 level to hold as a crucial base before a rough, non-linear recovery begins. The short-term target is $61.00 over the next two to three weeks, an approximate 10% rally, though the stock faces significant overhead resistance around $66.50.
QQQ Rally Expected as RSI Hits Critical Support
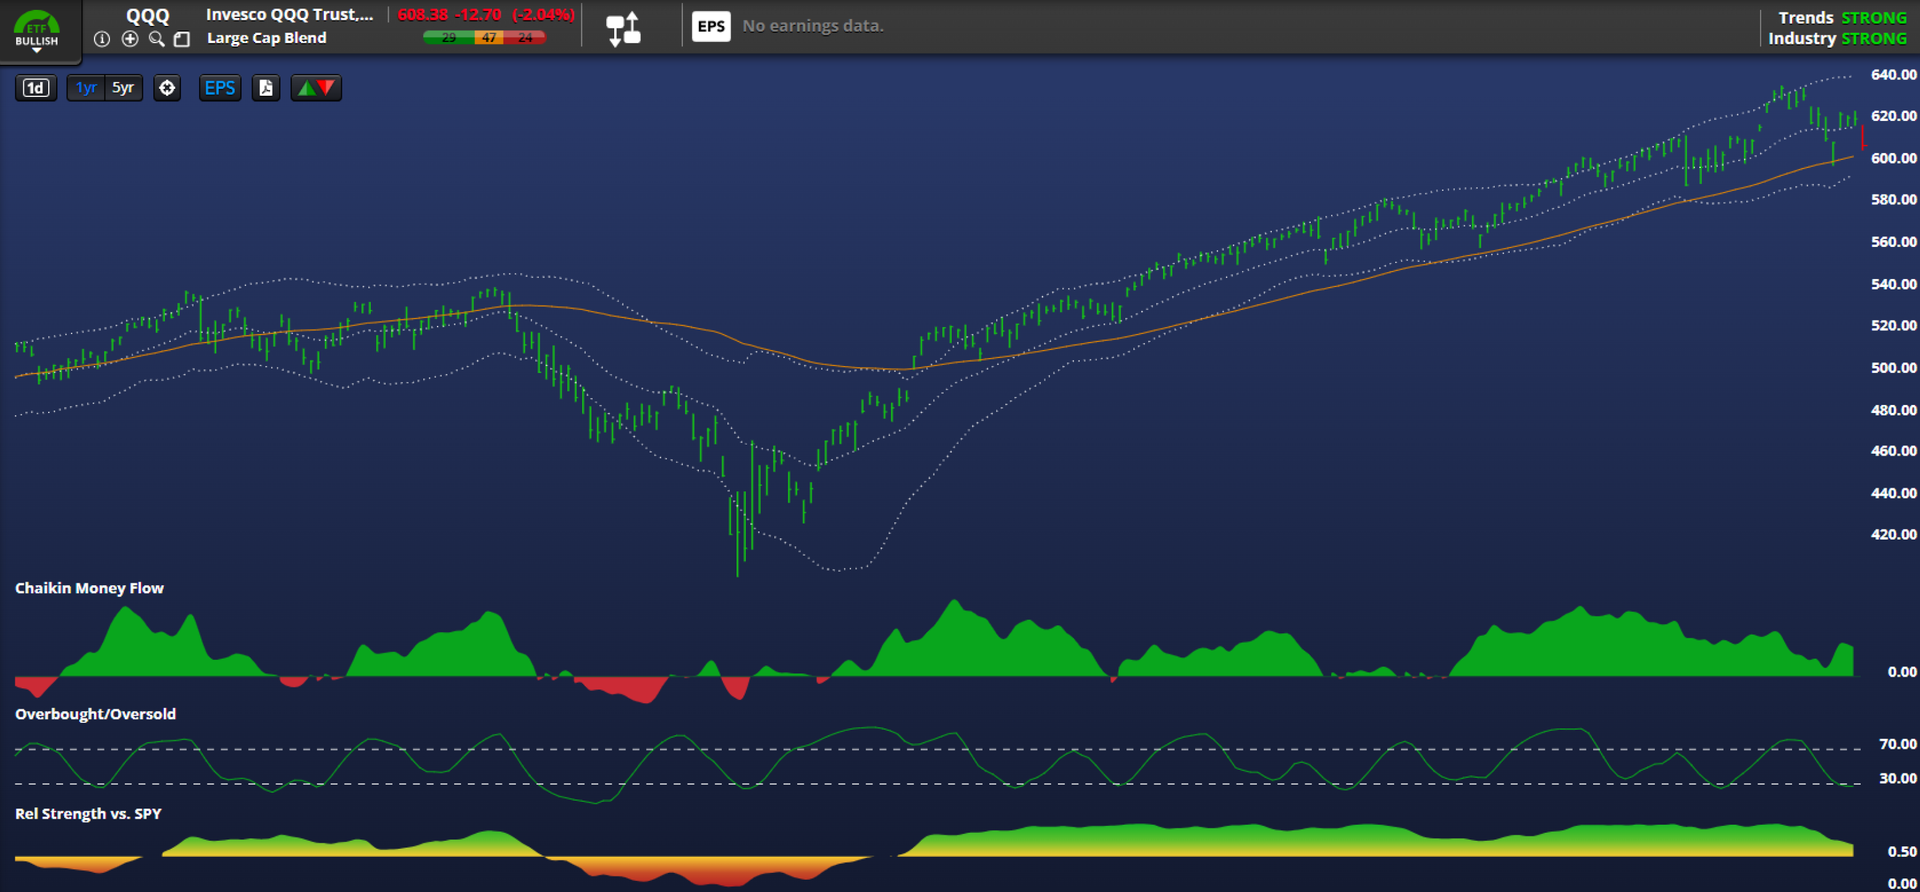
The Invesco QQQ ETF (QQQ) has continued its decades-long stellar performance this year, demonstrating even stronger relative strength than the SPY since early May. The ETF’s rising 200-day moving average (DMA) now sits at $541, far below its current trading range, underpinning a solid long-term bullish trend that propelled QQQ to an all-time high of $637 on October 29th. This robust uptrend followed a powerful breakout above $540 earlier this year, maintaining an RSI above 45 since April and showing extraordinary flow strength.
The aggressive 2% sell-off on Thursday has pushed the RSI down to 47, a critical level that has consistently marked the bottom of recent corrections, including those on October 10th, October 29th, and throughout August. Historically, the ETF traded below its 200DMA from early March through mid-May before breaking out and entering overbought conditions, a pattern that establishes deep support at the $541 DMA. The recent correction acts as a necessary cool-down after the massive rally from the 52-week low of $402 struck on April 7th.
Given the historical tendency for corrections to halt at the RSI 47 level, we expect QQQ to base here, with a technical floor holding firmly at $600. This basing action should precede a significant recovery, which is forecasted to result in a 5% rally to approximately $639—setting new all-time highs—over the next three weeks. QQQ’s extraordinary flows and superior relative strength suggest this current dip is merely a pause within a larger bullish trend.
XLF Financials Poised for $54 Retest
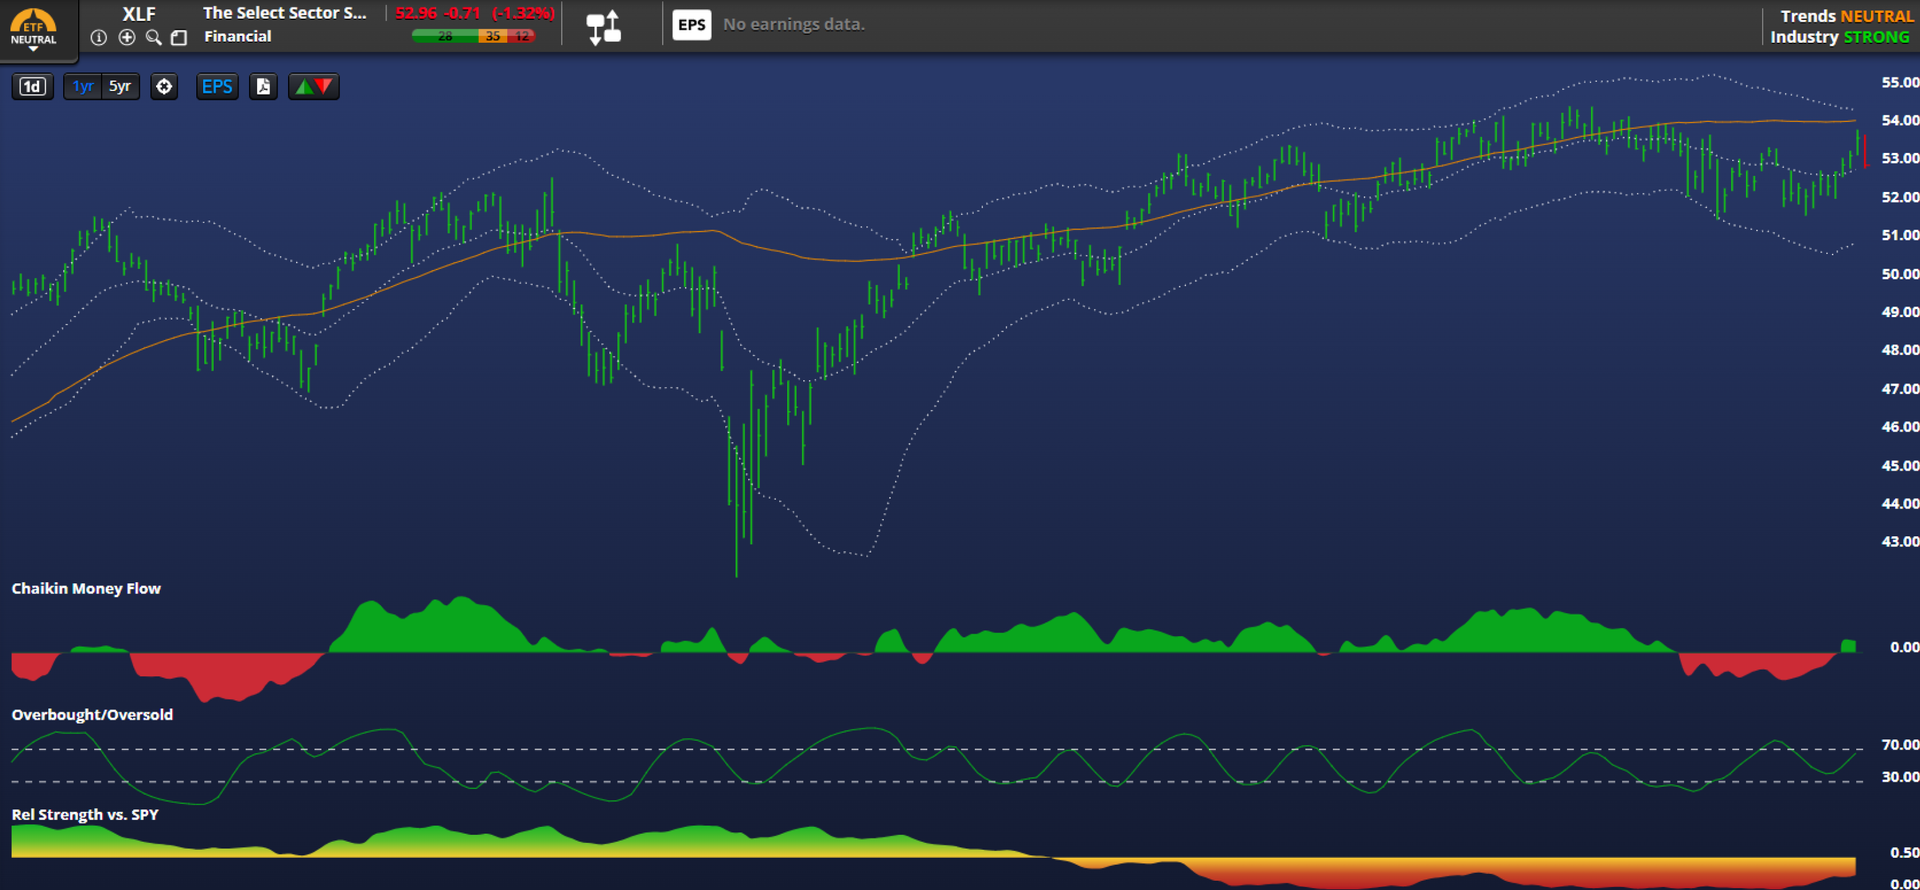
The Financial Sector SPDR Fund (XLF) is a critical instrument underpinning the US bull market, characterized by a rising 200-day moving average (DMA) that now provides solid support at $51.35. Despite achieving an all-time high of $54.00 on September 18th, XLF has been losing relative strength against SPY since June, hinting at recent institutional profit-taking rather than bubble-bursting behavior. The group spent a remarkably short period under its 200DMA (April 4th–22nd), quickly regaining bullish footing after only briefly reaching an oversold status.
A notable bearish divergence occurred at the September 18th all-time high when the RSI reached only 60, suggesting lukewarm participation in the final leg up, followed by considerable time trading under an RSI of 50. This weak momentum contrasts sharply with European financials (EUFN), which are currently hitting all-time highs. XLF has not been in overbought territory since July 3rd, indicating that the current dip is a momentum cool-down, not a crash.
In the short term, we anticipate a period of light bullish action over the next week, targeting a retest of $54.00, which should then face a small correction back toward $52.00. Given the strong long-term trend, we believe XLF should return to its winning ways in December to forge new all-time highs, provided the critical $51.35 200DMA support holds firm. The primary risk lies in a decisive break below the $52.00 level.
IWM Small-Caps Poised to Recapture $252
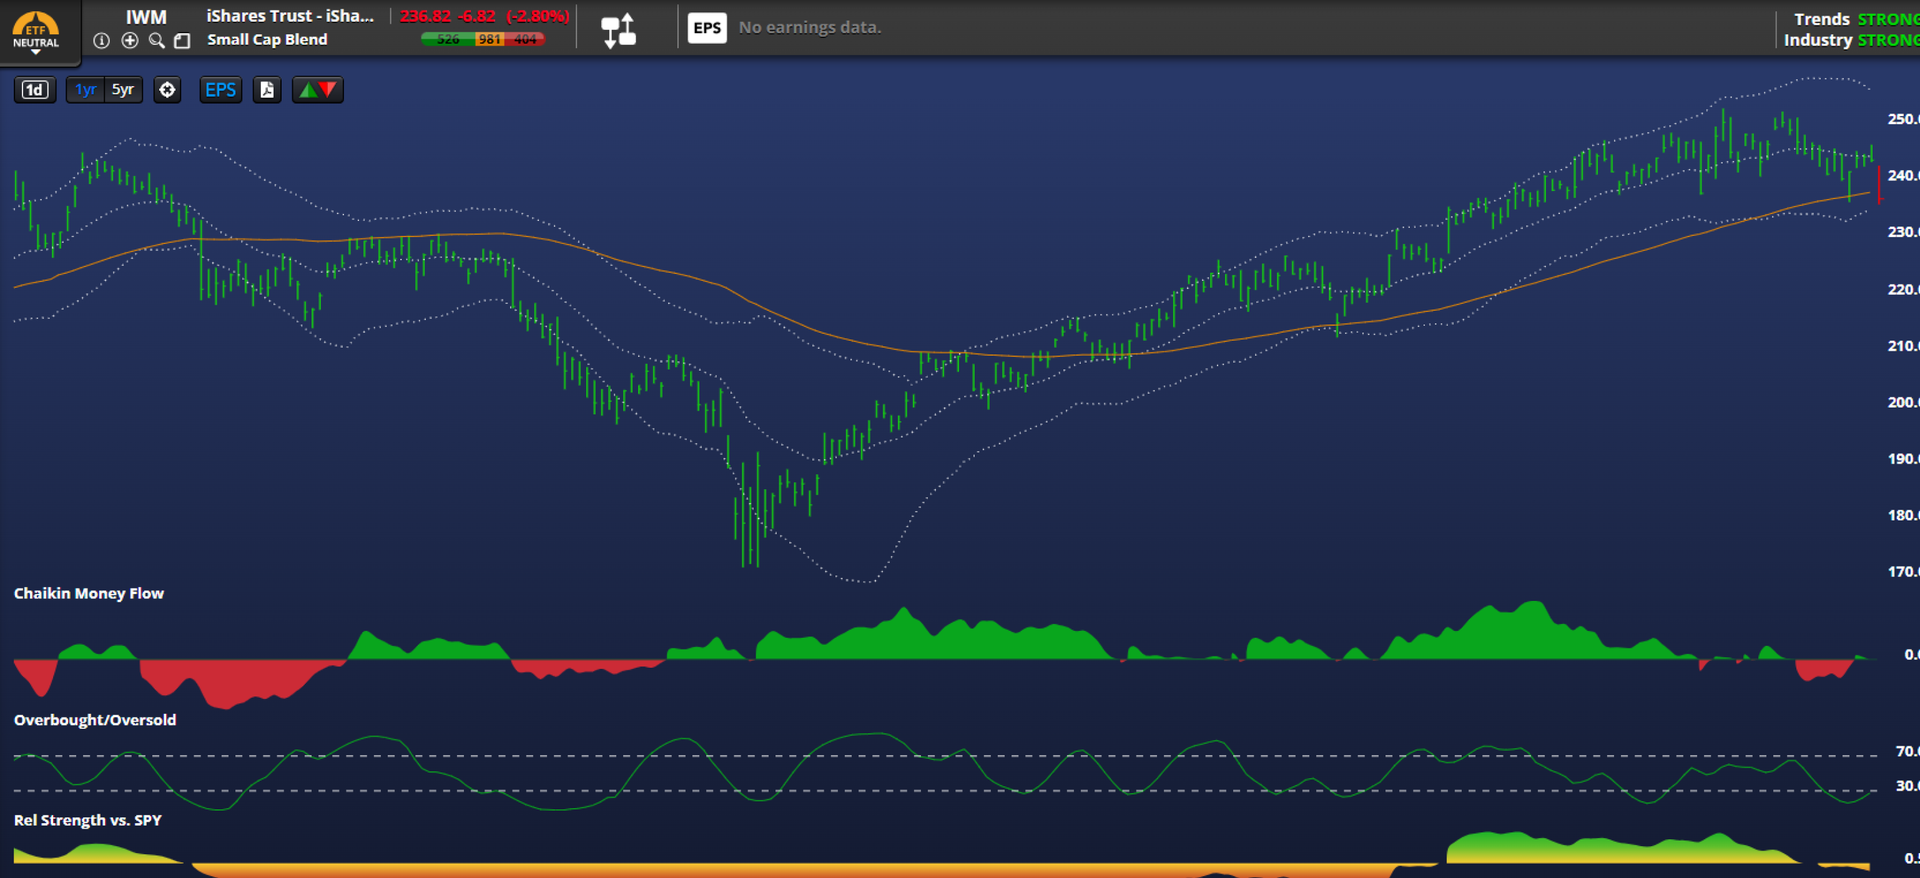
Lastly, we will close with the iShares Russell 2000 ETF (IWM), or the small-caps. This index presents a distinctly different technical picture from mega-caps like SPY and QQQ because its constituency is not so overexposed to the AI theme.
Looking at the chart, IWM was essentially “dead money” all year, showing limited enthusiasm: briefly oversold in March and April, and overbought just once on July 3rd. The 200-day moving average (DMA) was basically flat until the week of its 52-week high, which occurred on October 15th at nearly $253 a share. It experienced an ugly sell-off, down 2.8% on Thursday.
The current 200DMA lies at $220. In terms of momentum, the RSI is currently at 41, a level that previously marked a significant bottom on August 1st when the price tagged its 200DMA. IWM had been beating SPY in relative strength from mid-August through late October but is now giving that advantage back.
I believe over the next two to three weeks, we will first base here with a $235 floor, which is very close to the current price (just inside 1%). The subsequent rally over the next two to three weeks should take IWM +6% to $252.00 a share, matching its 52-week high.


John Salama, CMT, is a Chartered Market Technician since 2021 with over 15 years of institutional derivatives experience. Currently, John is a proprietary trader who systematically utilizes technical analysis. He shares his expertise by broadcasting his trading process three days a week at market close on his YouTube channel, aiming to educate retail traders. He is also a regular interviewee for Business Insider.

Shared content and posted charts are intended to be used for informational and educational purposes only. CMT Association does not offer, and this information shall not be understood or construed as, financial advice or investment recommendations. The information provided is not a substitute for advice from an investment professional. CMT Association does not accept liability for any financial loss or damage our audience may incur.
