Investopedia is partnering with CMT Association on this newsletter. The contents of this newsletter are for informational and educational purposes only, however, and do not constitute investing advice. The guest authors, which may sell research to investors, and may trade or hold positions in securities mentioned herein do not represent the views of CMT Association or Investopedia. Please consult a financial advisor for investment recommendations and services.
XOM: Repeating Bearish Patterns Point to Caution Ahead
The monthly chart of Exxon Mobil (XOM) reveals a striking repetition of bearish technical patterns, combining rounding tops, bearish divergence, and EMA crossovers.
In 2008, 2014, and 2024, XOM formed prominent rounding tops — a classic sign of distribution where buying momentum stalls, and sellers begin to take control. Adding to this, the RSI exhibited a bearish divergence each time: price reached higher highs while RSI made lower highs, signaling weakening momentum beneath the surface.
A key trigger in past cycles was the 10-month EMA crossing below the 20-month EMA, which confirmed the shift in trend. Currently, the 10 EMA is about to cross below the 20 EMA again, raising the risk of another major rollover.
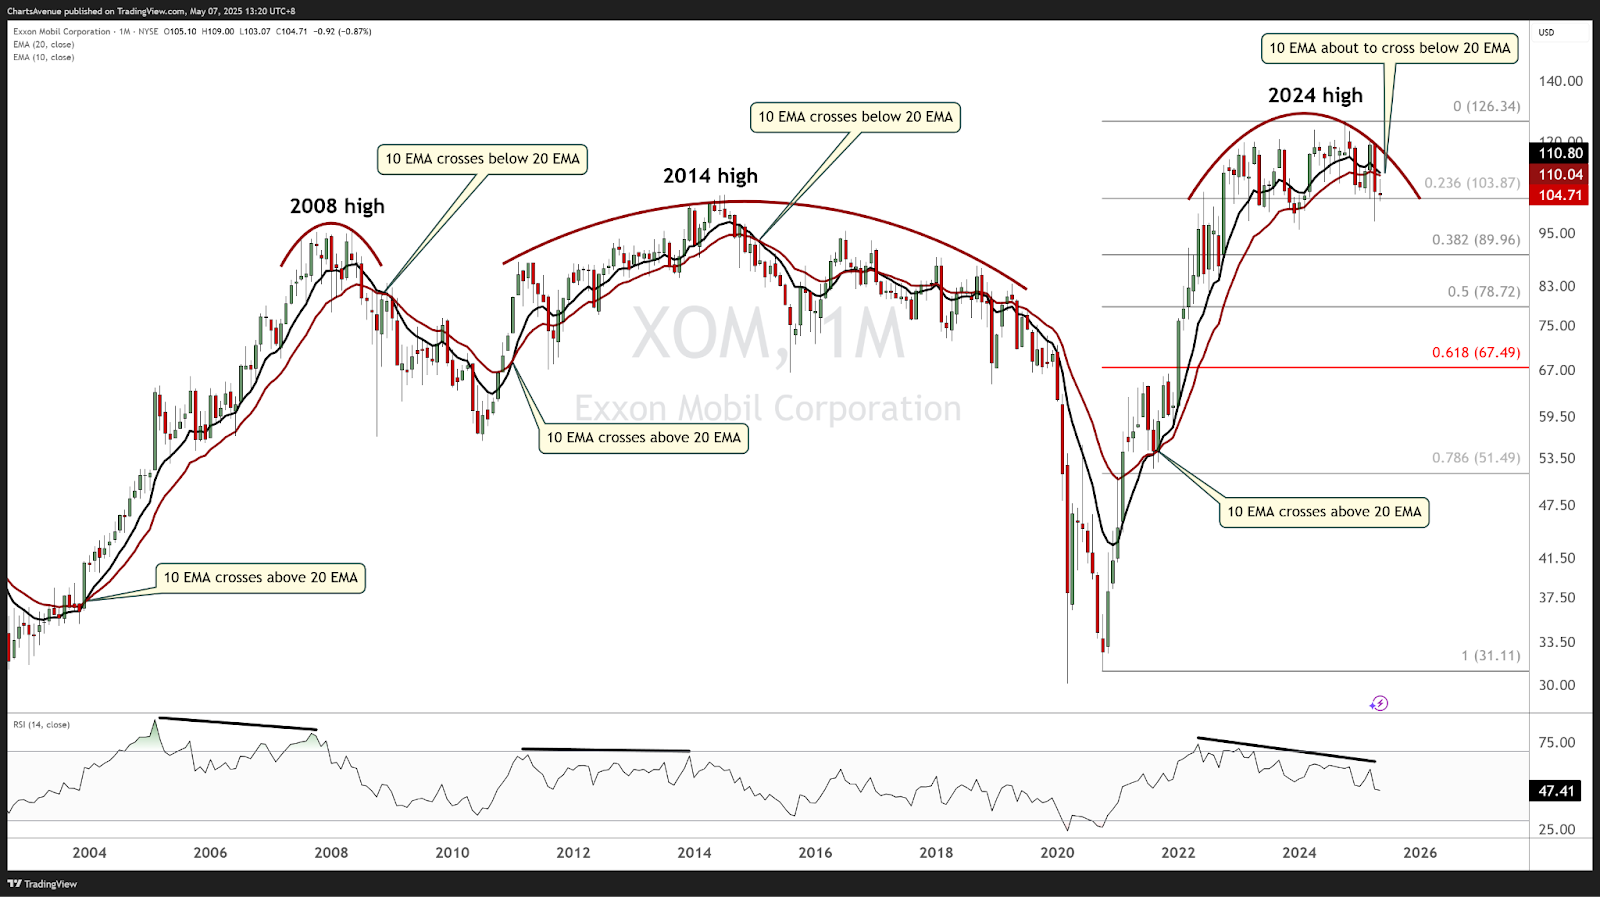
Chart 1: https://www.tradingview.com/x/QoJOLZPj/
The price is now hovering just above $103.85 which represents the 0.236 Fibonacci retracement from the prior advance. A break below that support area could trigger a deeper retracement towards the next Fibonacci retracement levels, currently sitting at $90, $79 and $67.50.
XPENG (9868 HK): Approaches Key Breakout Level
The daily chart of XPENG (9868.HK) shows a well-defined series of technical events over the past year.
The stock first struggled in July 2024, getting rejected near the 100-day EMA, which acted as dynamic resistance, and the price eventually rolled over. It then regained strength, and in September 2024 decisively broke above the 100-day EMA – a key shift in market character – to start a sustained uptrend.
Since then, the 100 EMA has acted as a rising dynamic support zone, with the price bouncing off this level in January 2025 and most recently in April 2025. Each test has resulted in a higher low.
The price is now approaching a downward-sloping resistance trendline drawn from the early 2025 highs. A break above this trendline would confirm a bullish breakout and open the door for a renewed rally. Conversely, failure at this level could trigger another pullback to the 100-day EMA, which remains a key level to monitor.
Chart 2: https://www.tradingview.com/x/yXueUtYH/

As XPENG is trading in a bullish structure above its upward sloping 100-day EMA, the price should be able to clear its current overhead resistance for further upside.
RHB BANK: 9-Year Base Breakout Sets Stage for Major Upside
The weekly chart of RHB Bank Berhad (RHBBANK) shows a major technical breakout from a rounded base formation that has been developing for nearly a decade, a massive 9-year to be precise, resolving into a bullish breakout.
(The bigger the base the higher in space, remember?).
Since 2015, RHBBANK has struggled to clear the critical MYR 6.28 horizontal resistance, with failed attempts in 2016 and again in 2022. Notably, this same level acted as major support back in 2011 before the multiyear decline began, making the recent breakout even more meaningful.
In late 2024, the stock finally broke decisively above the MYR 6.28 level, signaling a structural shift in supply and demand. Importantly, price has since pulled back to retest this breakout zone, which is now acting as support. Holding this level confirms the breakout and strengthens the bullish case.
The breakout projected upside targets using Fibonacci extensions are:
- The 1.618 extension at MYR 7.58, and
- The 2.618 extension at MYR 9.69
Additionally, a target can be derived from the height of the base pattern itself. Measuring the vertical distance from the low of the base to the MYR 6.28 breakout zone and projecting that upward gives a target just below the second Fibonacci extension level, further reinforcing the MYR 9.50 – 9.70 area as a key upside zone.
Chart 3: https://www.tradingview.com/x/QLjeTDEh/The Bottom Line:
RHBBANK’s breakout from a massive 9-year base is a powerful technical event, especially as it reclaims a former support-turned-resistance zone from 2011. As long as the MYR 6.28 area holds, the next milestones sit at MYR 7.58 and MYR 9.69, supported by both Fibonacci extensions and measured move pattern targets.
Shared content and posted charts are intended to be used for informational and educational purposes only. CMT Association does not offer, and this information shall not be understood or construed as, financial advice or investment recommendations. The information provided is not a substitute for advice from an investment professional. CMT Association does not accept liability for any financial loss or damage our audience may incur.
