| Investopedia is partnering with CMT Association on this newsletter. The contents of this newsletter are for informational and educational purposes only, however, and do not constitute investing advice. The guest authors, which may sell research to investors, and may trade or hold positions in securities mentioned herein do not represent the views of CMT Association or Investopedia. Please consult a financial advisor for investment recommendations and services. |
Growth Momentum Targets New $110 High After Massive Bounce
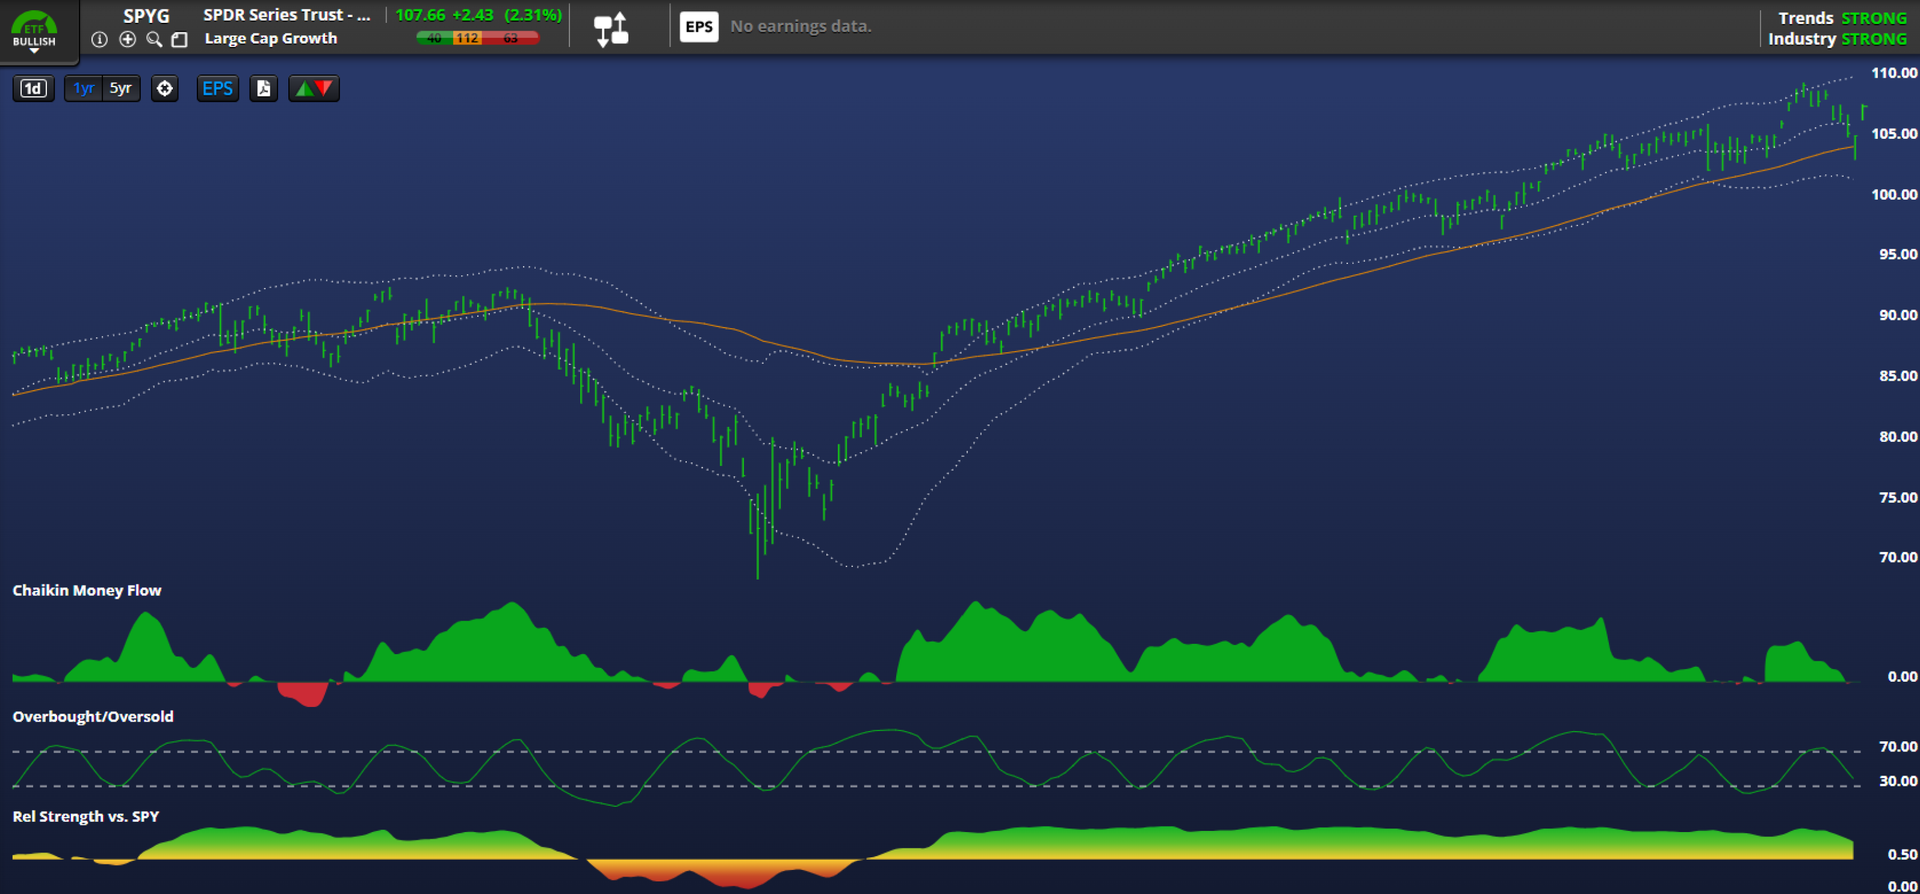
The S&P 500 Growth ETF (SPYG) is back in focus, marking a strong multi-standard deviation move by trading up 2.3% on Monday. This recovery follows a brief, sharp dip from its all-time high of nearly $110 a share on October 29th, to a near-term low of $103 last Friday. The swift appearance of a strong reversal candle at the bottom led to sustained institutional buying at Monday’s open, confirming immediate price support.
Technical indicators overwhelmingly support the ETF’s exceptional strength. The Relative Strength Index (RSI) is holding well above 44, confirming that momentum stabilized quickly after the dip, and the price remains convincingly above a rising 200-day moving average since early May. This persistent performance is further corroborated by exceptional money flow metrics which have been positive since May, allowing SPYG to outperform the core S&P 500 (SPY) throughout the current growth cycle.
While minor consolidation is possible this week, specifically under the 21-day exponential moving average at $106, investors can anticipate a swift absorption of capital, mirroring the rapid snap-backs seen all year. The clear investor appetite confirms that any pullback should be viewed as a prime buying opportunity rather than a point of concern. Given this continued exceptional demand and bullish technical posture, the short-term price target for late November is $110, set to eclipse the previous all-time high.
VXX: Volatility Set for New All-Time Lows After Massive Decline
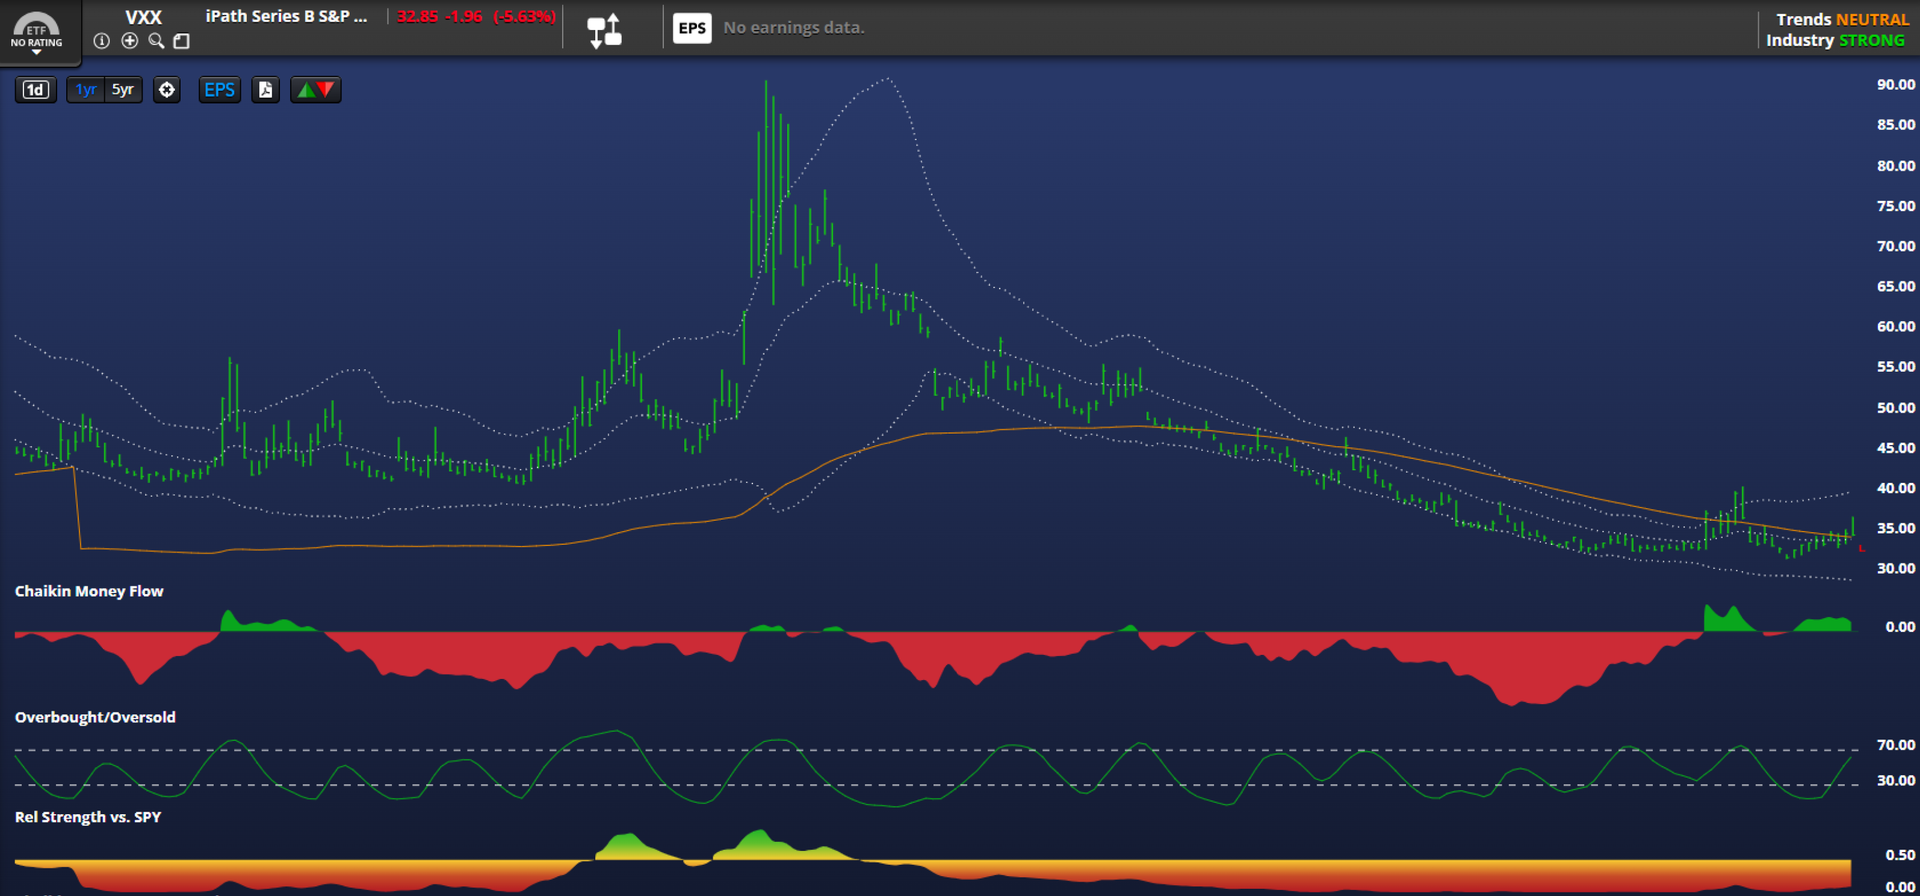
The iPath S&P 500 VIX Short-Term Futures ETN (VXX) has registered a powerful multiple-standard deviation decline, dropping a sharp 5.6% on Monday. This movement confirms the relentless structural weakness that has plagued the instrument since late June, concurrent with the surging equity market. After falling decisively under its long-term 200-day moving average, VXX printed a new all-time low of nearly $32 a share on October 27th, marking its exceptionally weak posture.
While the VXX is inherently difficult to chart due to the constant roll-over of short-term VIX futures, technical action provides clear near-term boundaries for trading. Following this extreme sell-off, we anticipate a brief, counter-trend rebound over the next few days. However, this recovery is expected to stall and fail decisively at the $35 level, which represents the ceiling of the current short-term bear cycle. For historical reference, VXX’s volatility peaked earlier this year, spiking to $91 during the April tariff crisis.
Aside from the brief equity market scare between October 10th and 20th, VXX remains a poor vehicle for capital allocation. Prior periods of oversold readings in July, August, and September were quickly absorbed, failing to sustain any meaningful rally. Given the overwhelming bearish momentum and VXX’s persistent inverse correlation with the underlying equity market, we expect the instrument to print new all-time lows. The firm downside target is $31 by the end of November, confirming the path of least resistance is firmly down.
Gold Miners Maintain Leadership, Target $82
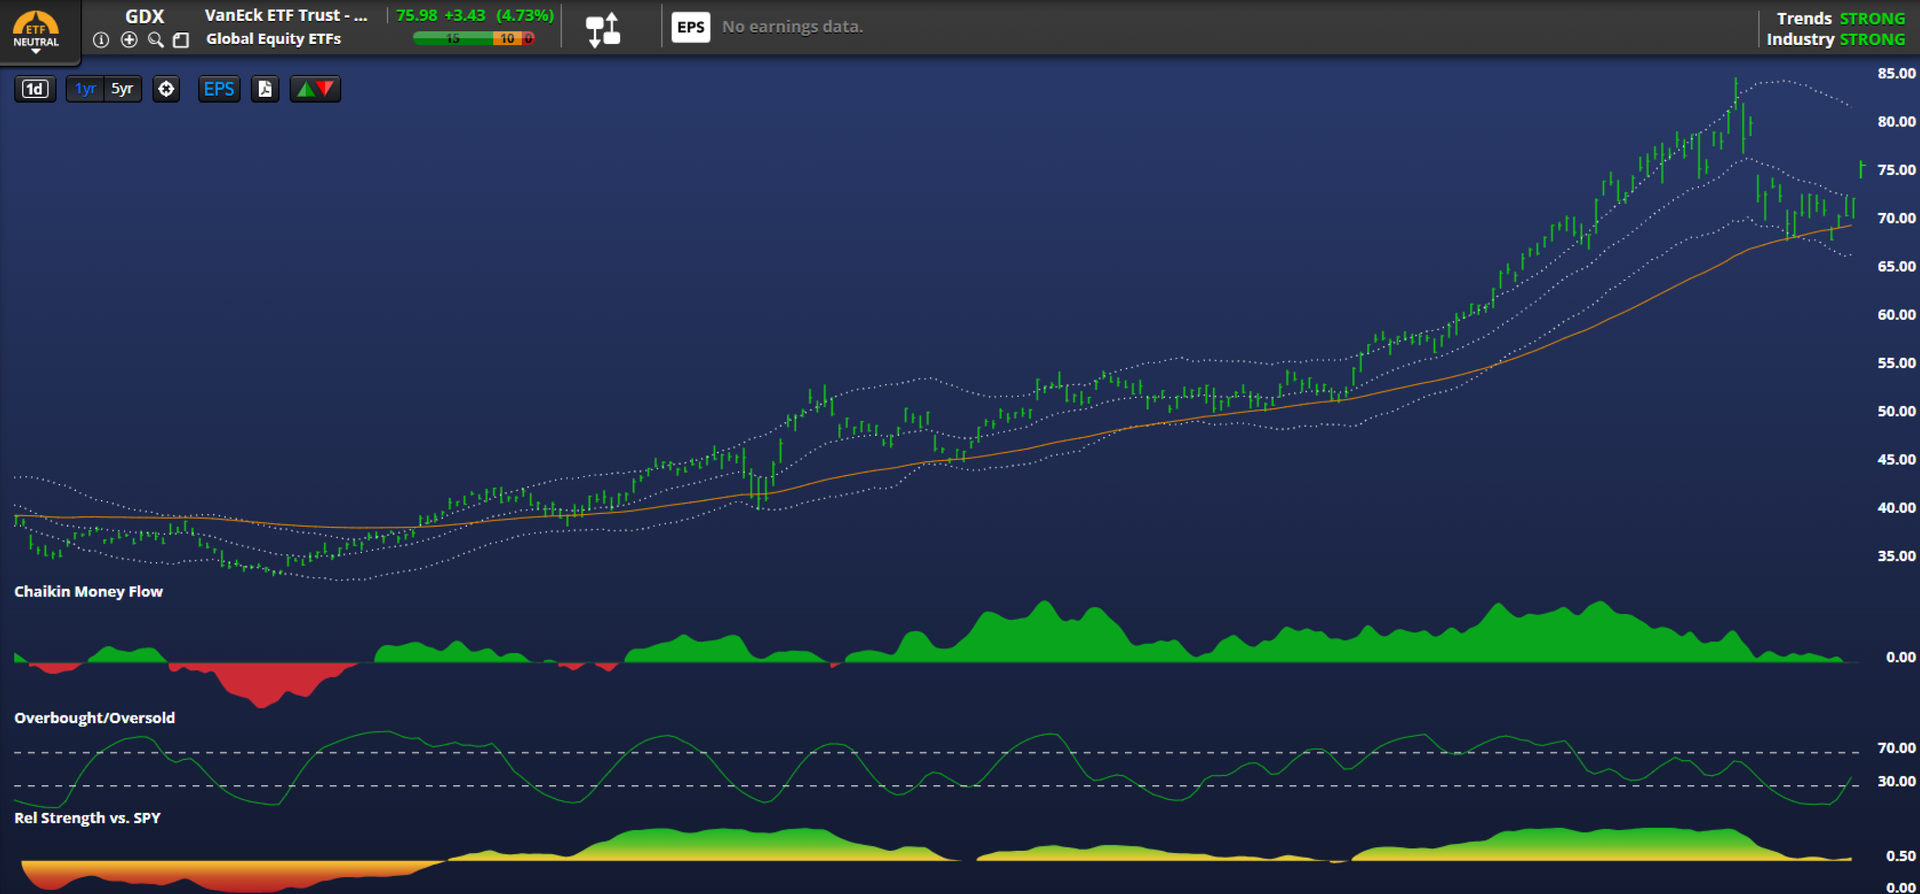
The VanEck Gold Miners ETF (GDX) has demonstrated significant technical strength, evidenced by a powerful +7% performance over the last five trading days. This recent move involved bouncing decisively off its short-term support bottom near $68, confirming the commitment of institutional buyers. GDX remains an absolute market leader, having rallied 94% over the past twelve months. Historically, entries positioned at the 21-day moving average, currently near the $73 level, have been promptly rewarded, making this zone critical for accumulation.
The long-term bullish structure of GDX remains firmly intact. Crucially, the instrument has not closed below its essential rising 200-day moving average since mid-January, which underscores the robust strength of its primary uptrend. Furthermore, the Relative Strength Index (RSI) recently bottomed at the 40 level. This reading mirrors the technical setup seen during the powerful April advance, confirming that the current move is consolidating healthily and is not indicative of a structural breakdown.
GDX recently celebrated a superb, sustained overbought period from late August through early October, successfully driving the price from $61 up to $79. While the 52-week high was struck at $85 on October 16th, the current momentum and technical floor suggest a clear continuation of the upward trajectory. The near-term price target for the end of November is set at $82, and consistent with its position as a market leader, all pullbacks in price should be viewed as sustained buying opportunities.
Ark Innovation Prepares for New Highs
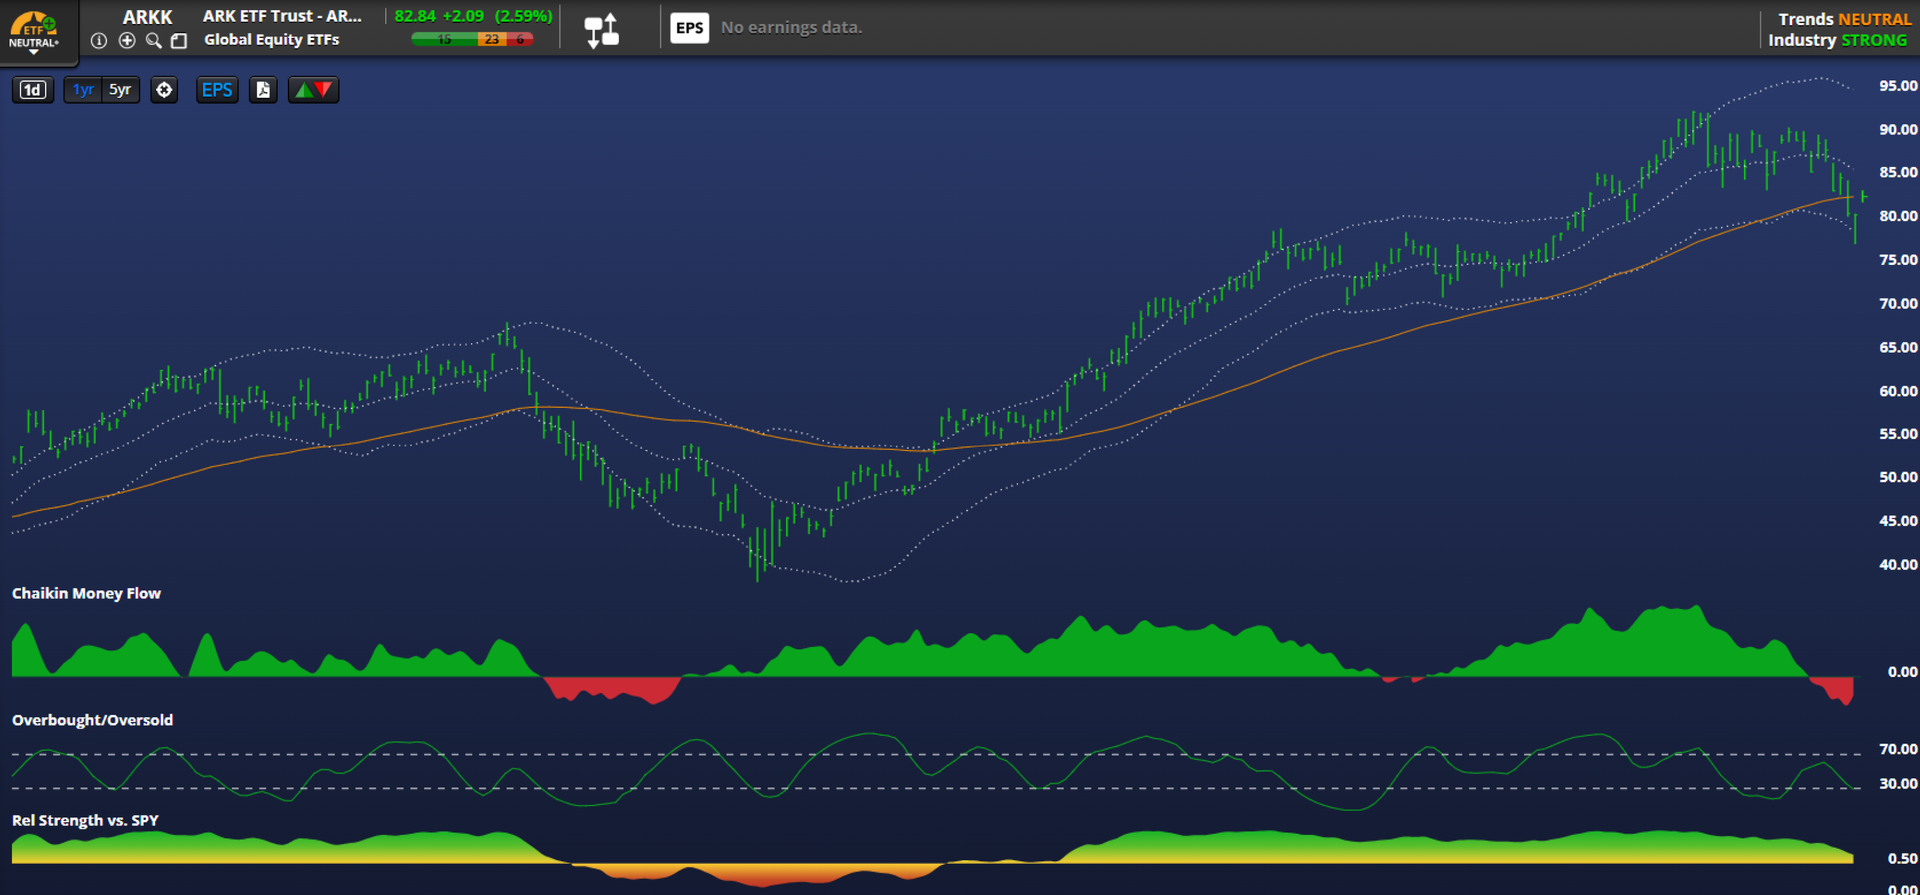
The ARK Innovation ETF (ARKK) stands out as a formidable year-over-year leader, boasting impressive 55% gains that confirm its long-term bullish momentum. This period of strength has, however, encountered some recent weakness down 6% over the past 5 days, with the ETF slipping just under the 50 mark on its Relative Strength Index (RSI). This technical dip is unusual for ARKK, requiring historical reference back to April, when the fund was last emerging from its 52-week lows, to find a similar instance of consolidation.
Despite this recent consolidation, the fund is supported by a robust, rising 200-day moving average, which has served as a technical floor. Notably, this average held firm even when ARKK traded in a sideways, corrective phase beneath it from mid-March through mid-May. ARKK, led by Cathie Wood, has previously demonstrated the ability to sustain momentum, experiencing robust overbought environments during June, July, September, and October.
While the potential for further near-term basing remains for the rest of this week, the attractive risk/reward profile suggests accumulation under $86 is warranted. The solid technical floor for committed buyers appears to be near the $79 mark. With the previous yearly high struck on October 8th near $93, the clear directional target for early December is a return to, and eventual breakout of, those new high levels.
South Korea Drives Global Tech Momentum
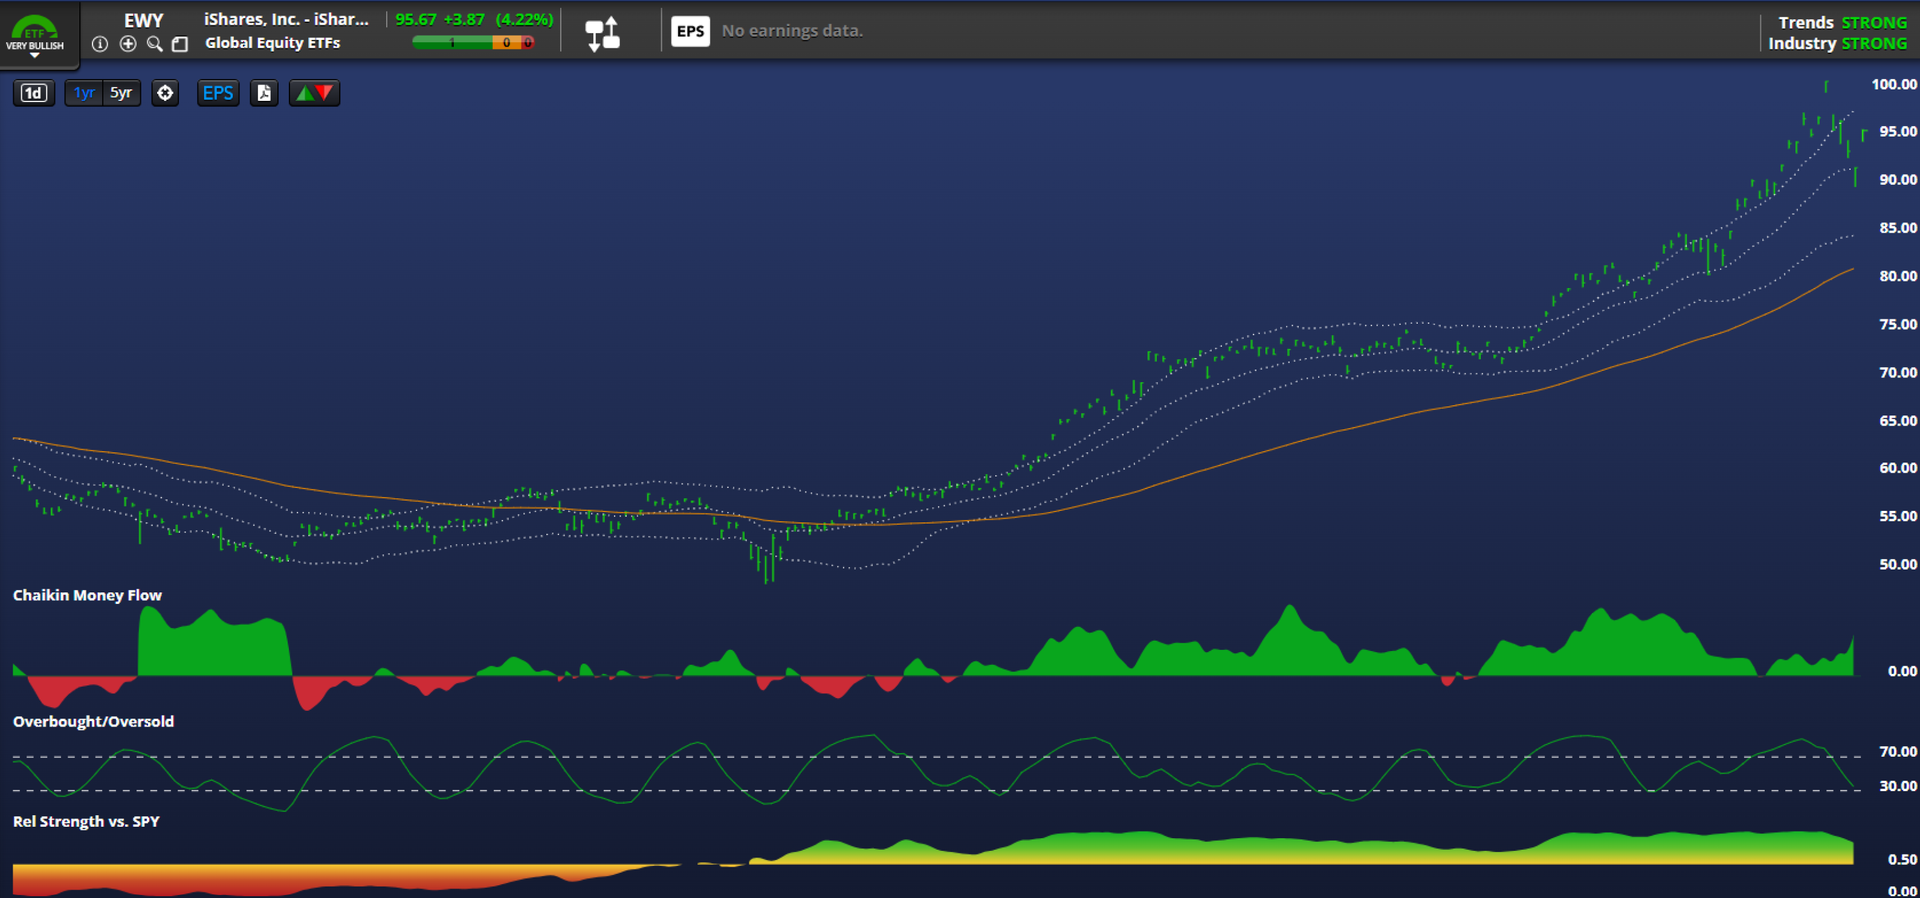
The iShares MSCI South Korea ETF (EWY) has cemented its status as a global technology leader, delivering a remarkable 61% year-over-year gain, including a strong 4.2% advance on Monday. This impressive run is built on a solid technical foundation that began when the ETF hit its 52-week low near $48 on April 8th. Although its 200-day moving average was initially sliding, EWY managed its first decisive close above this major trend line on May 14th, confirming the new long-term uptrend.
This structural shift gained considerable momentum in early June when the fund registered an overbought signal on its Relative Strength Index (RSI), providing the catalyst needed to accelerate the 200-day moving average’s incline. This energy carried the price to $72 by the end of June before the ETF entered a necessary consolidation phase, trading range-bound between $70 and $75 until early September. The defining price explosion occurred following a subsequent overbought registration in mid-September, rocketing the stock from $78 to new all-time highs of nearly $101 last week.
This aggressive, sustained movement is highly unusual for a geographical ETF, yet it is explained by EWY’s composition: it is largely a technology play, with Samsung Electronics comprising a massive 23% of the fund. Technical momentum indicators remain robust, with the RSI holding firmly above 43 since the April low. Traders are advised to look for entry points under $92 to establish long positions, targeting a return to $101 or new all-time highs for December, offering a compelling way to gain exposure to the global bull market beyond the Mag 7 tech stocks.

John Salama, CMT, is a Chartered Market Technician since 2021 with over 15 years of institutional derivatives experience. Currently, John is a proprietary trader who systematically utilizes technical analysis. He shares his expertise by broadcasting his trading process three days a week at market close on his YouTube channel, aiming to educate retail traders. He is also a regular interviewee for Business Insider.

Shared content and posted charts are intended to be used for informational and educational purposes only. CMT Association does not offer, and this information shall not be understood or construed as, financial advice or investment recommendations. The information provided is not a substitute for advice from an investment professional. CMT Association does not accept liability for any financial loss or damage our audience may incur.
