1/ USDCAD – Define Your Risk
It’s been a tumultuous year for the US Dollar, as it’s weakened against all other major world currencies. The decline was swift, but some USD pairs are now displaying signs of life. The USDCAD pair is now trading above the 50-day moving average and atop a tested support/resistance zone ~1.375. This zone briefly behaved as support back in May, and as resistance in June and July.
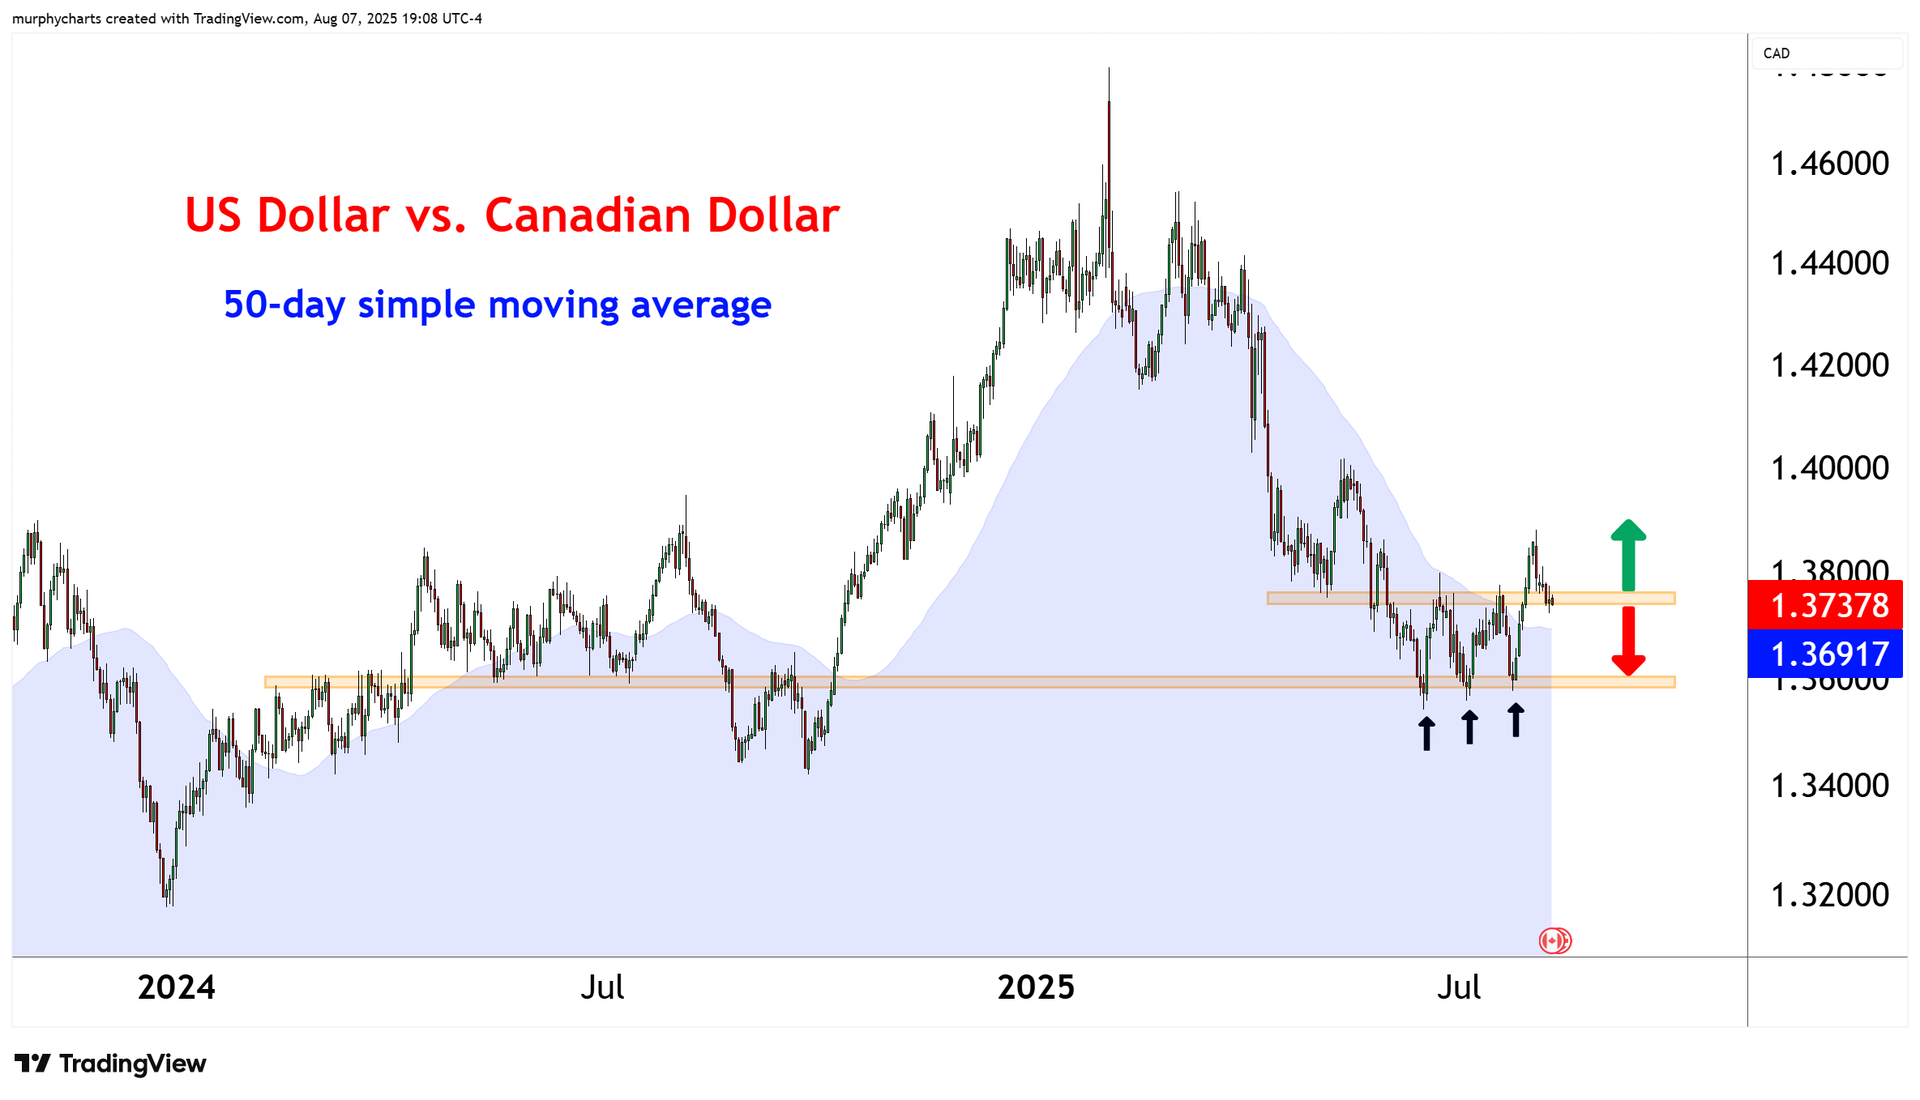
With the US Federal Reserve assigning more weight to labor market data than inflation – last Friday’s weaker than expected jobs number sent the dollar tumbling. Whatever your directional bias – the defined 1.375 support level will assist you in your trade plan. Manage risk, develop your target and let the market do the rest!
2/ Real Estate Diverging from Yields
It makes intuitive sense that if US yields fall, the real estate sector may experience a period of outperformance. The below chart displays the ratio of US Real Estate vs. US Stocks, overlayed with the US 10yr Treasury Note Yield. The chart goes back 12-months, with both series indexed to 100.
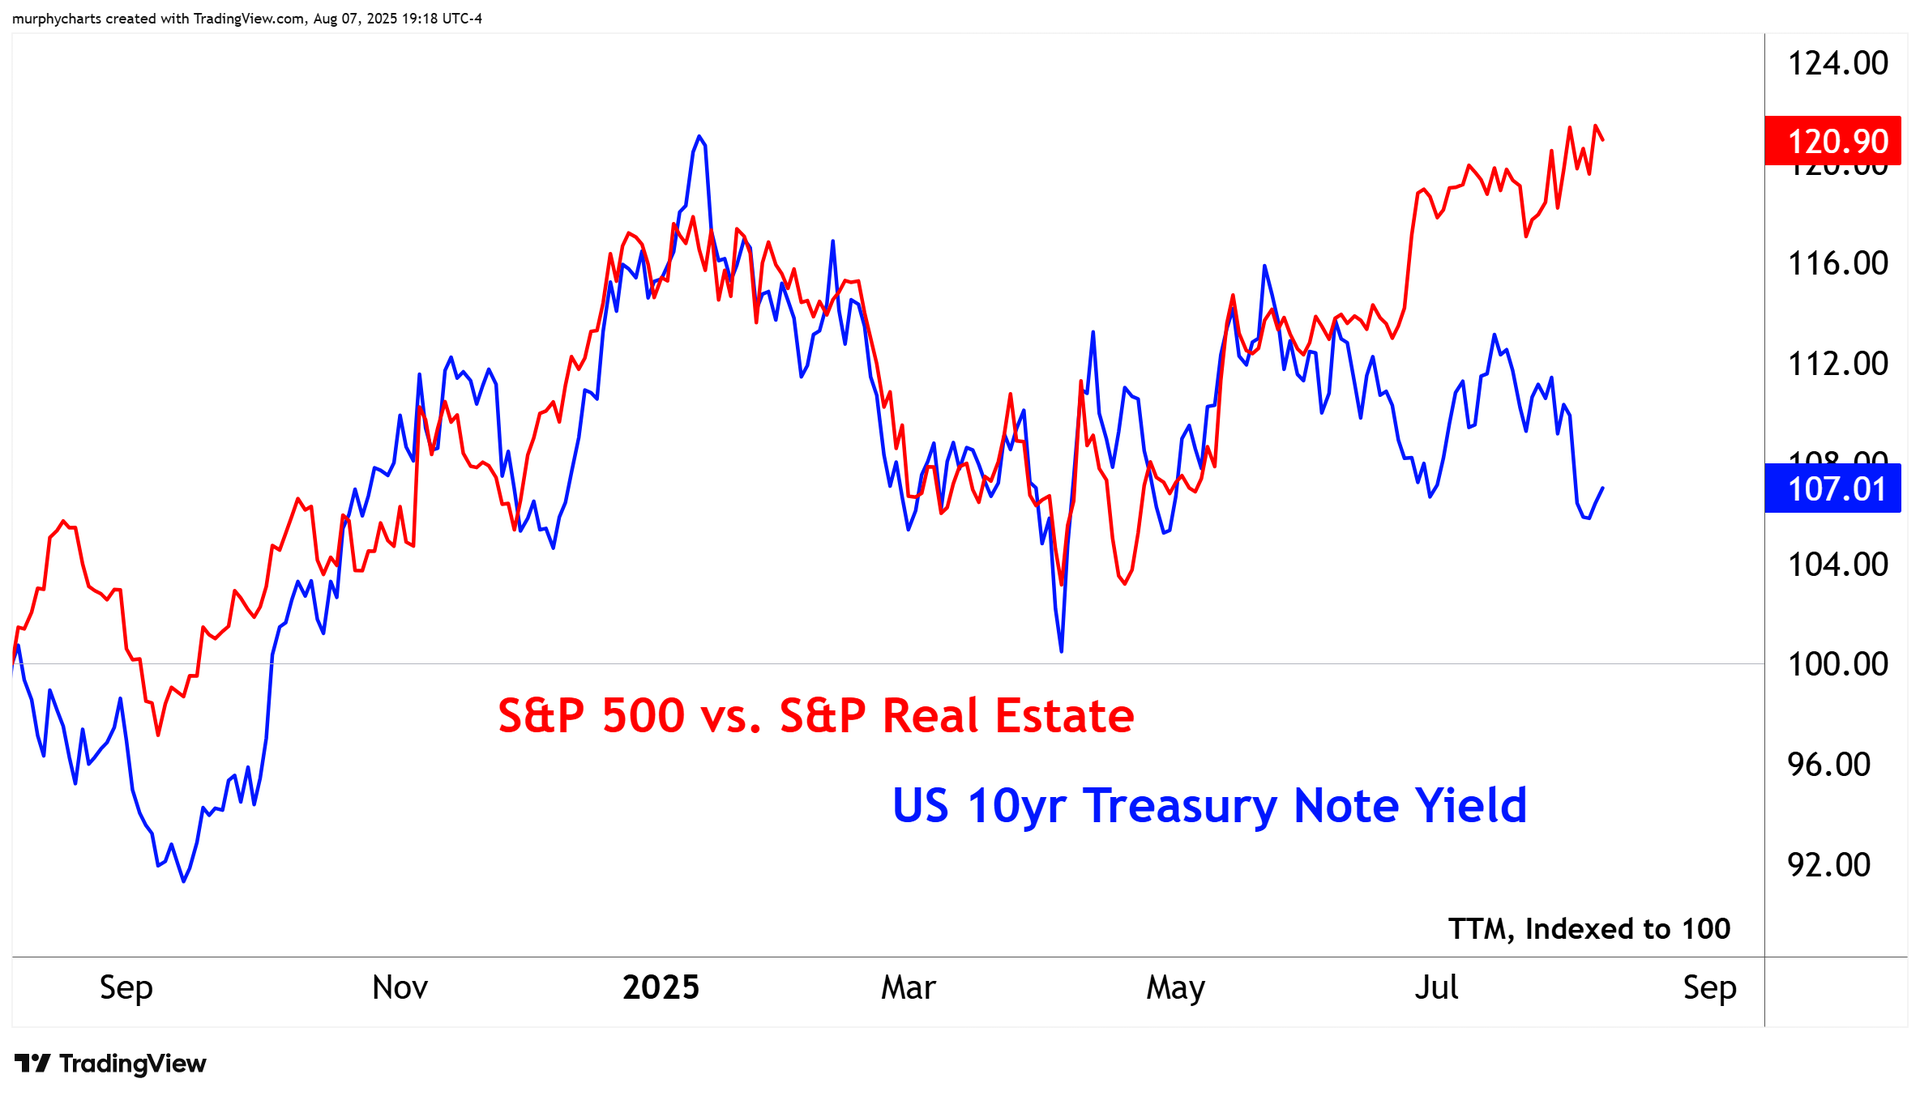
Despite US Yields being down year-to-date, the real estate sector has lagged the market significantly over the same period. If we are entering declining rate environment and real estate can’t outperform, what does that say about the health of the sector? I won’t pretend to know how this divergence will resolve – but I find it very interesting.
3/ Risk Appetite Gauge
IPOs are inherently risky assets. They’re typically younger companies, focused on growing revenues and establishing themselves in the marketplace. During speculative phases of a bull market, investors will buy IPOs for their lottery like preferences. The below chart displays a ratio of IPO stocks versus the broad market.
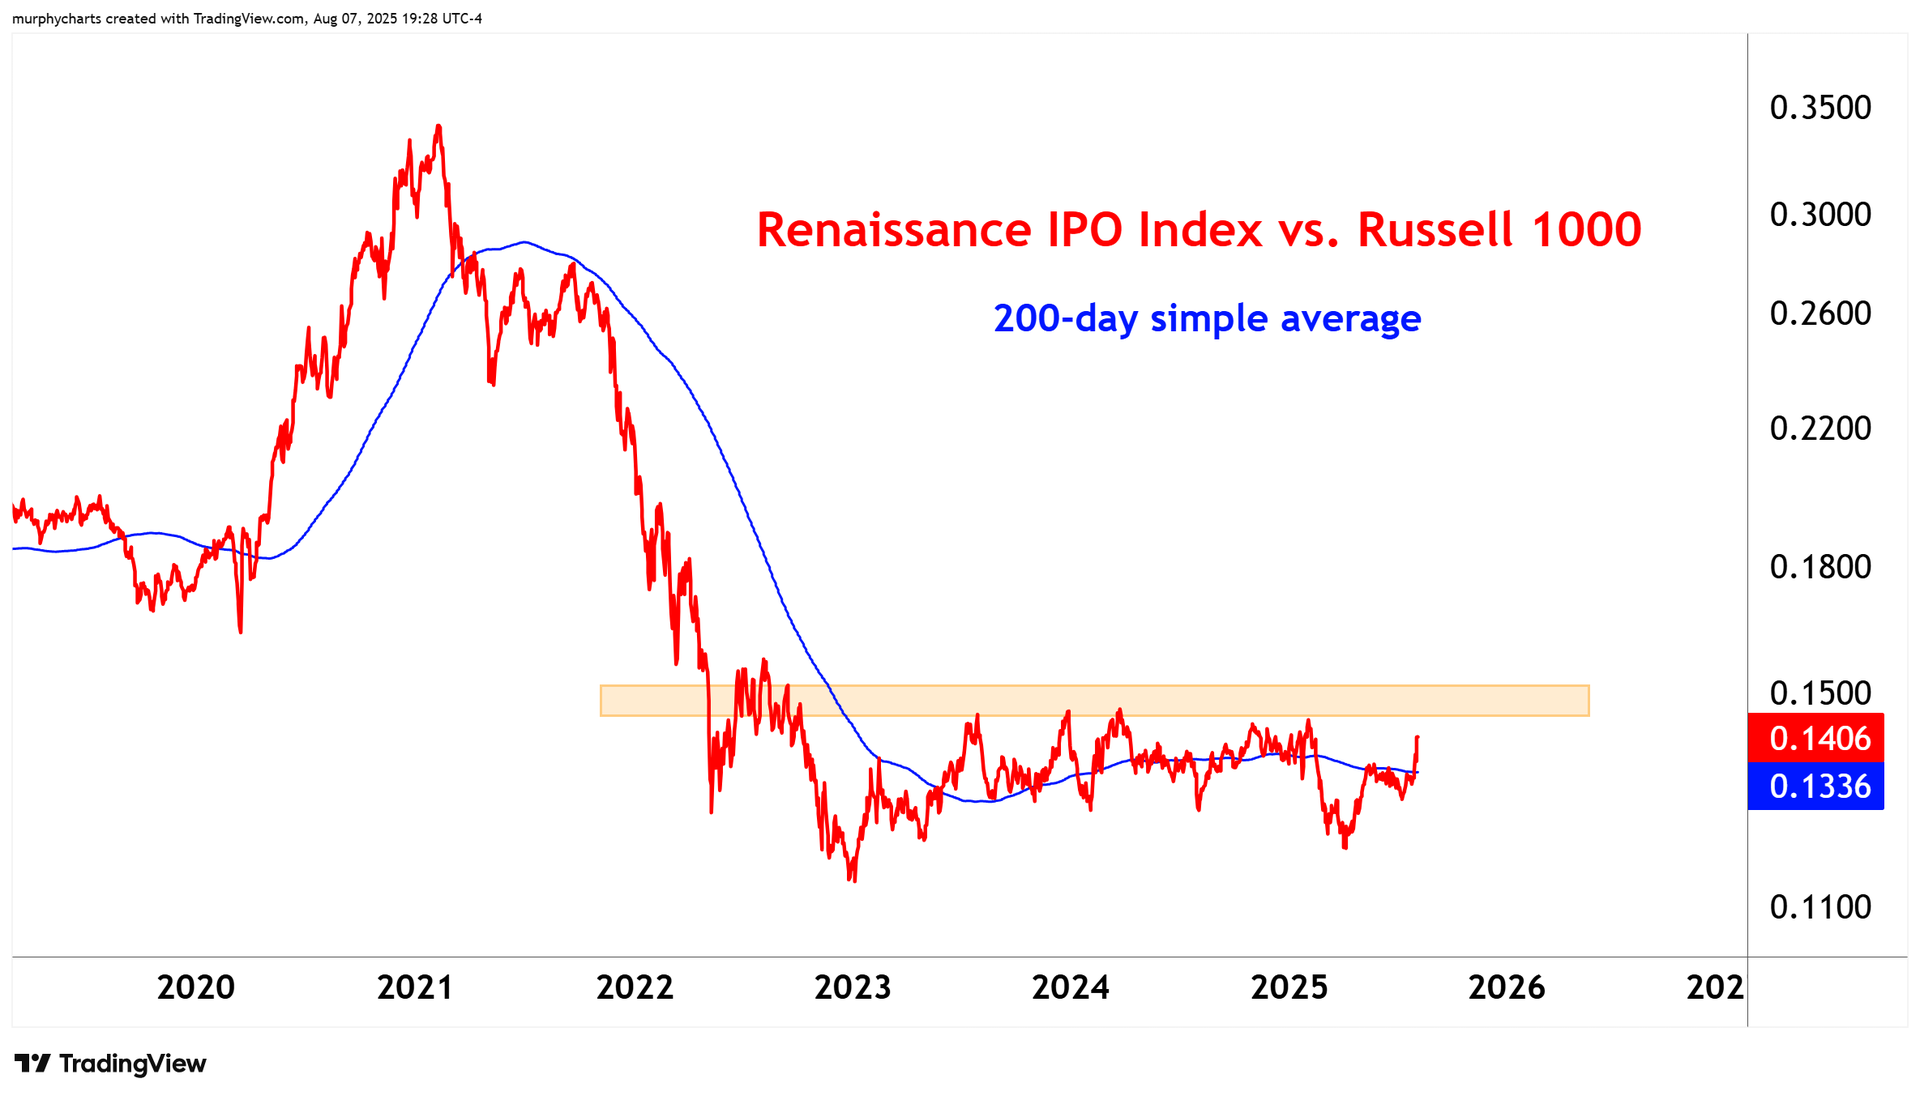
If we are entering a truly speculative phase of the market cycle, one should expect IPOs to outperform. The ratio has failed to form new highs for several years. A breakout would serve as evidence of increased risk appetite among investors.
Shared content and posted charts are intended to be used for informational and educational purposes only. CMT Association does not offer, and this information shall not be understood or construed as, financial advice or investment recommendations. The information provided is not a substitute for advice from an investment professional. CMT Association does not accept liability for any financial loss or damage our audience may incur.
