Update
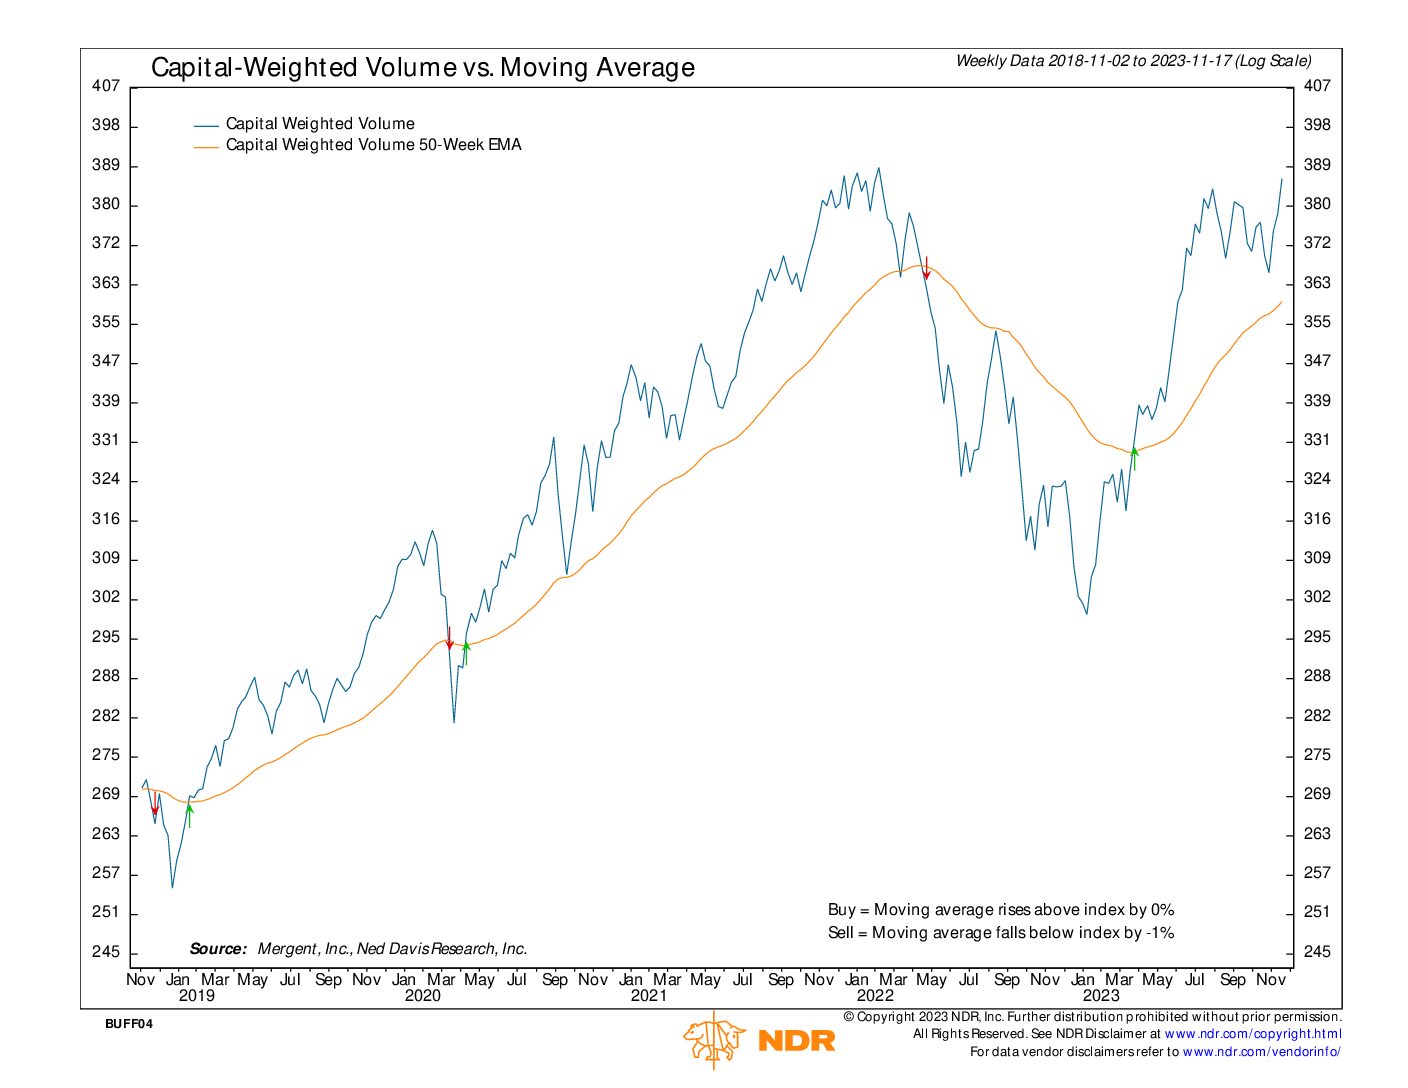
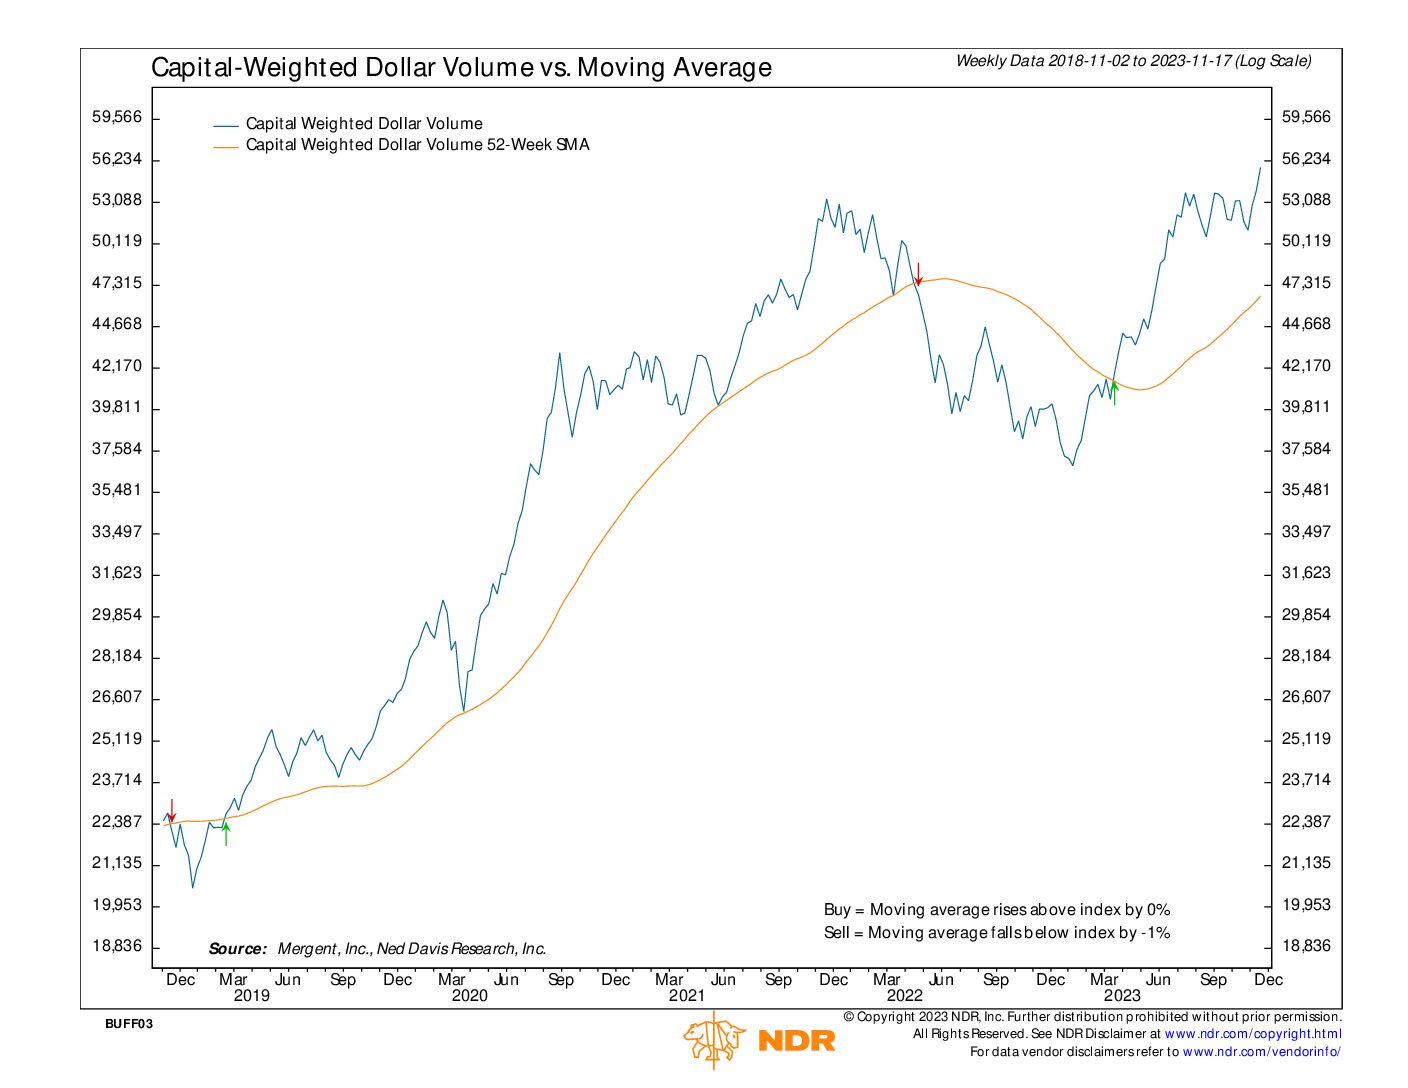
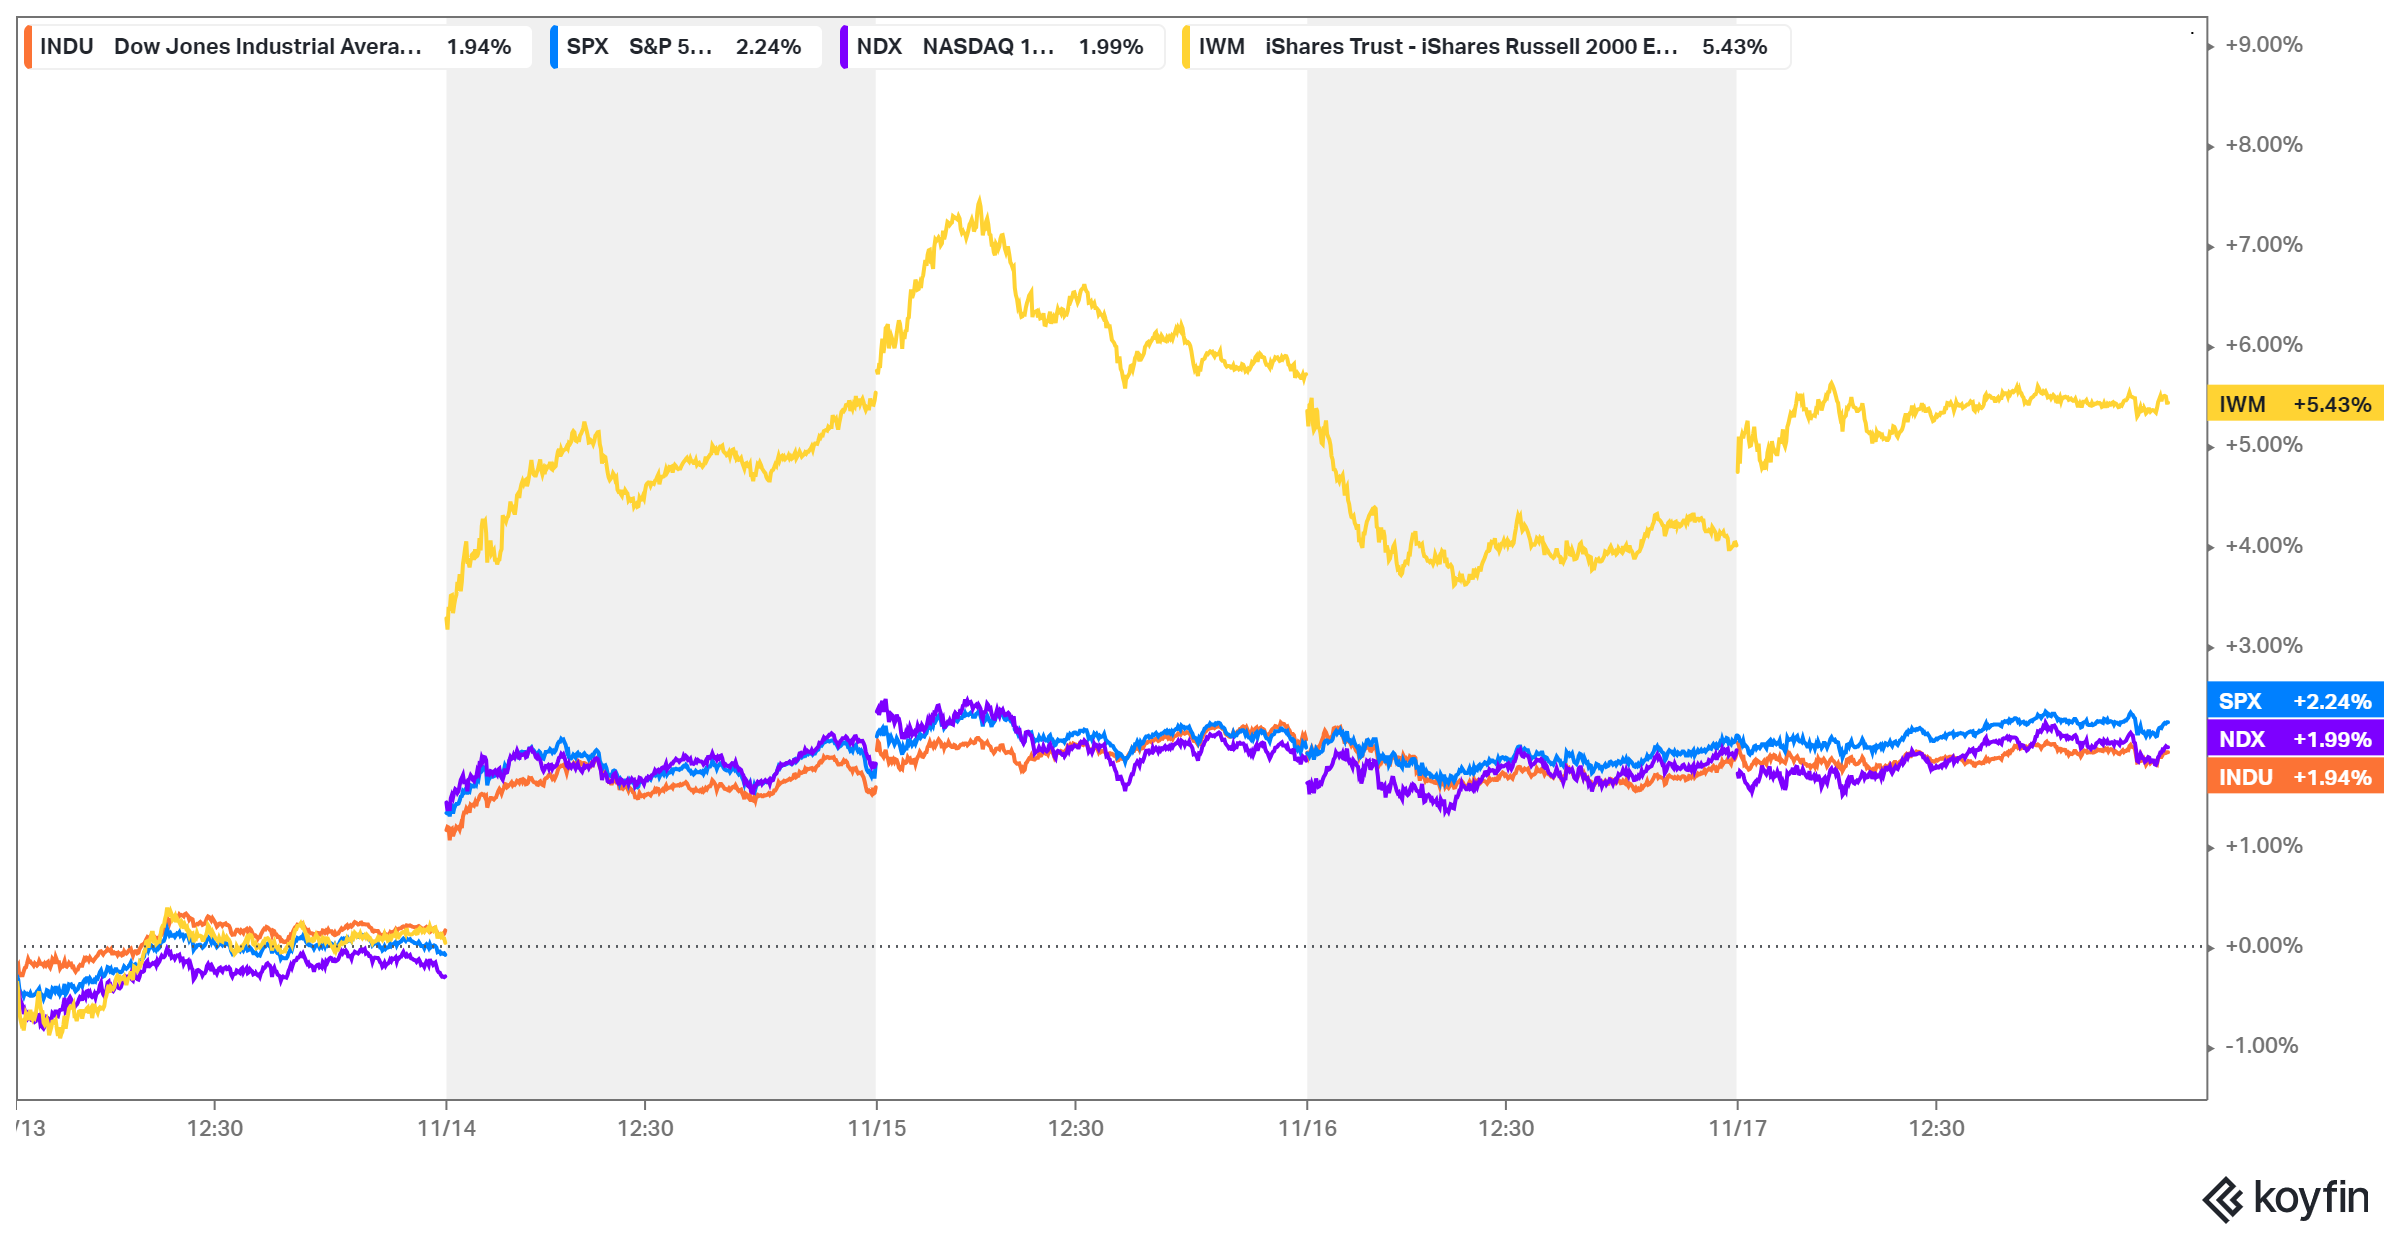
From our perspective, perhaps the prior week’s most significant development was S&P 500’s Capital Weighted Dollar Volume reaching all-time highs, marked by a notable surge in Capital Flows. Conversely, a potentially concerning development was observed as the Russell 2000 (troops) displayed weakness, diverging from the sustained strength observed in the NDX 100 (generals). However, in a turn of events this past week, the previously lagging troops led all indices, experiencing a 5.43% increase.
During this period, Capital Weighted Dollar Volume saw a breakout, attracting nearly $54 billion in Capital Inflows, while Capital Outflows amounted to less than $35 billion. This influx contributed to a 2.24% rise in the S&P 500 and a 1.99% increase in the generals (NDX 100).
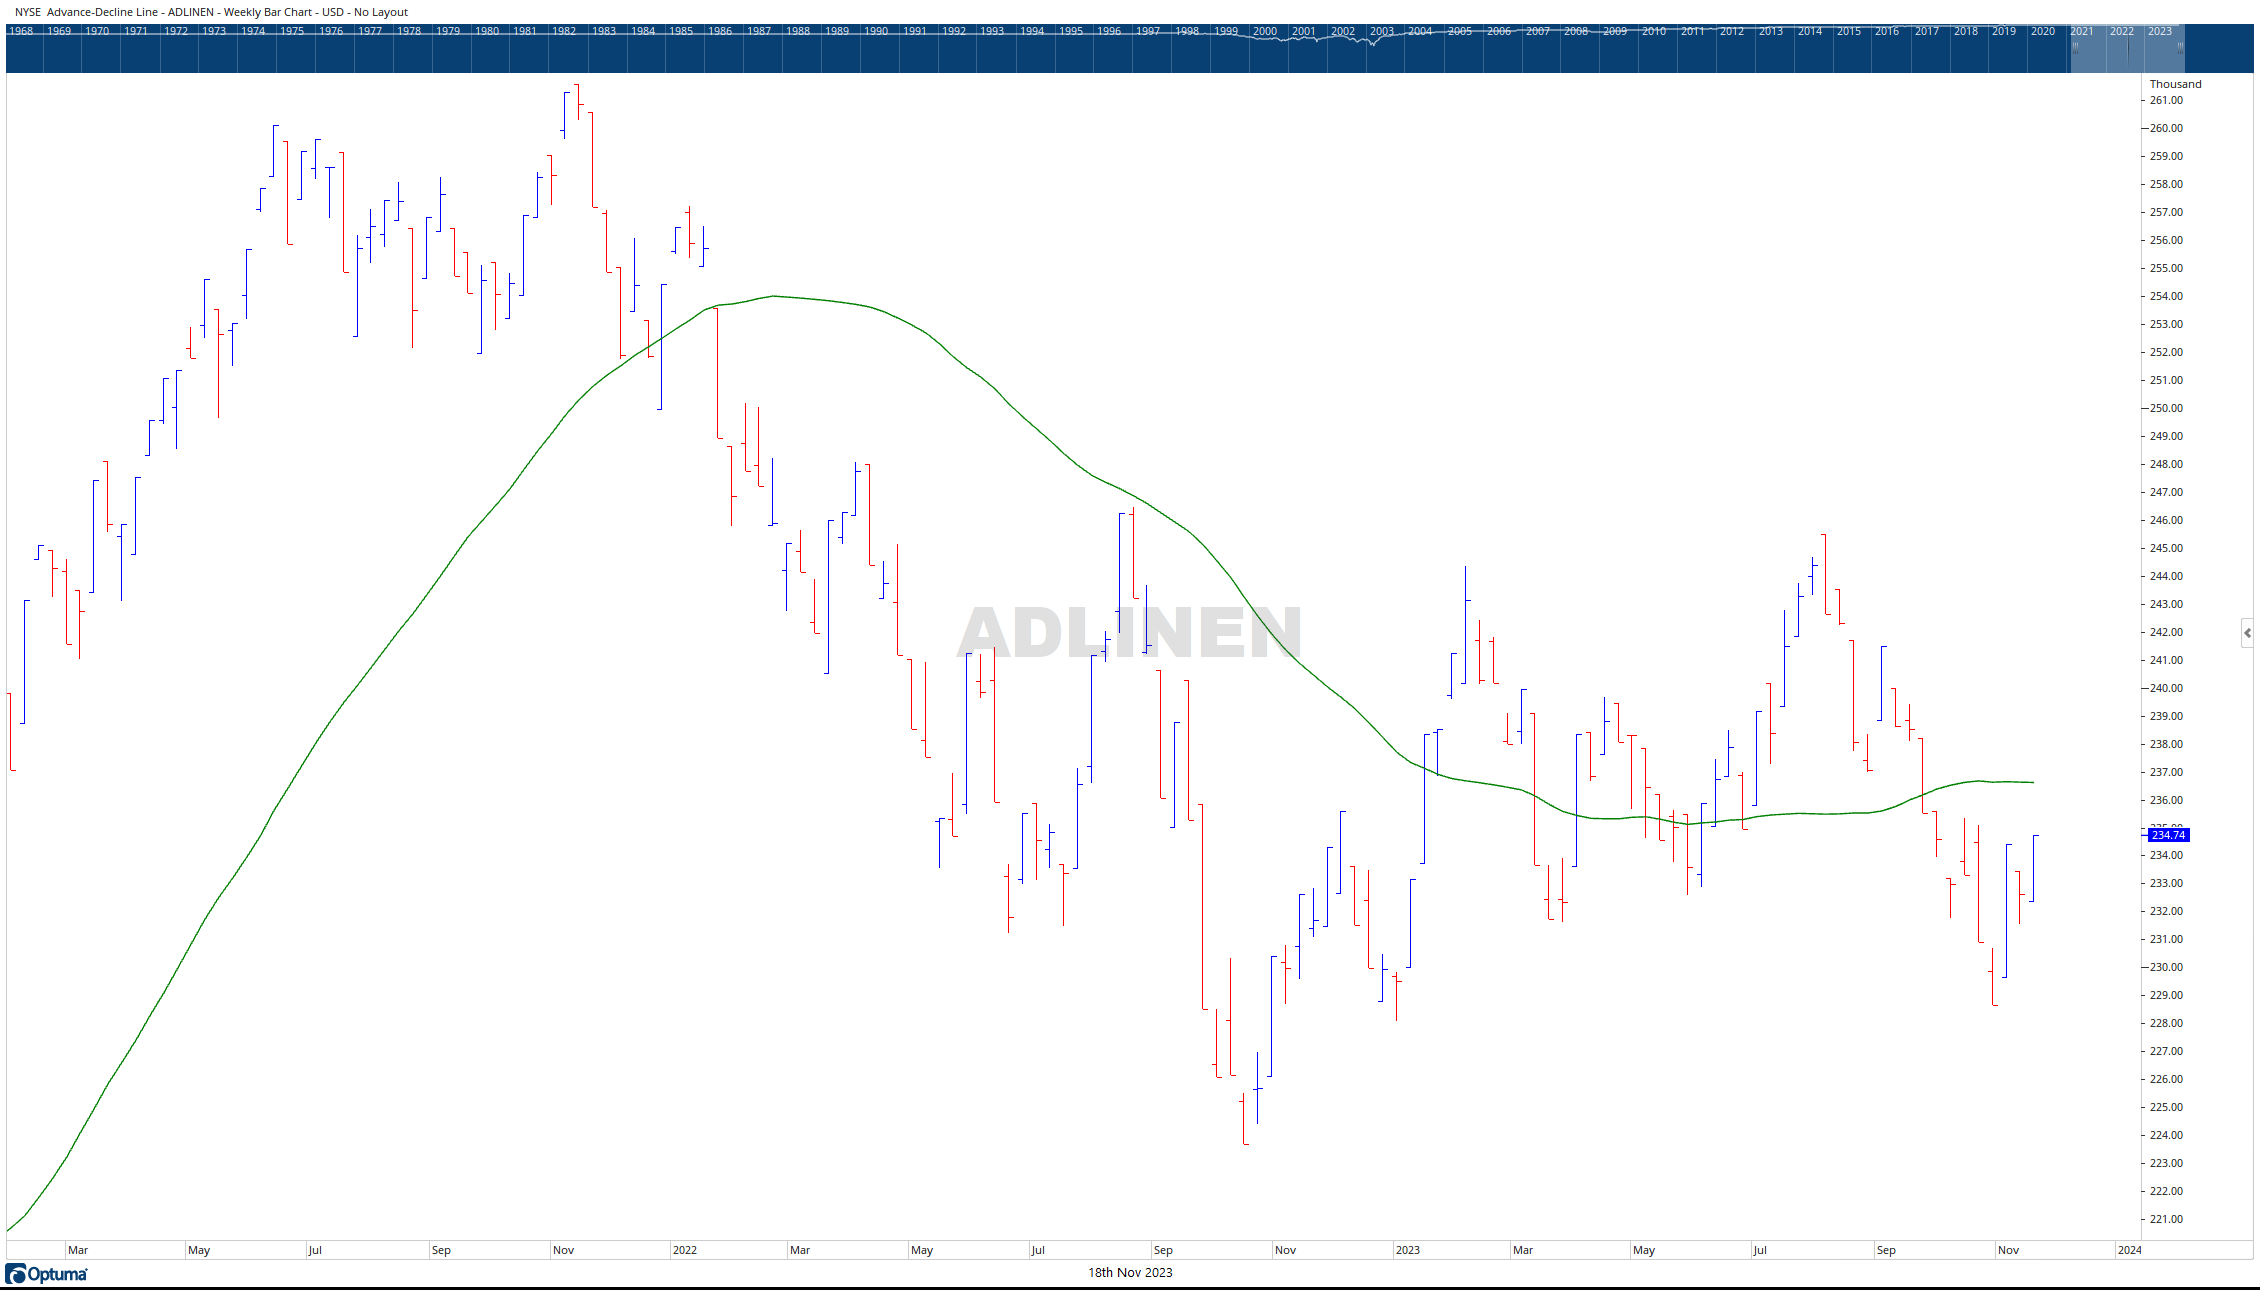
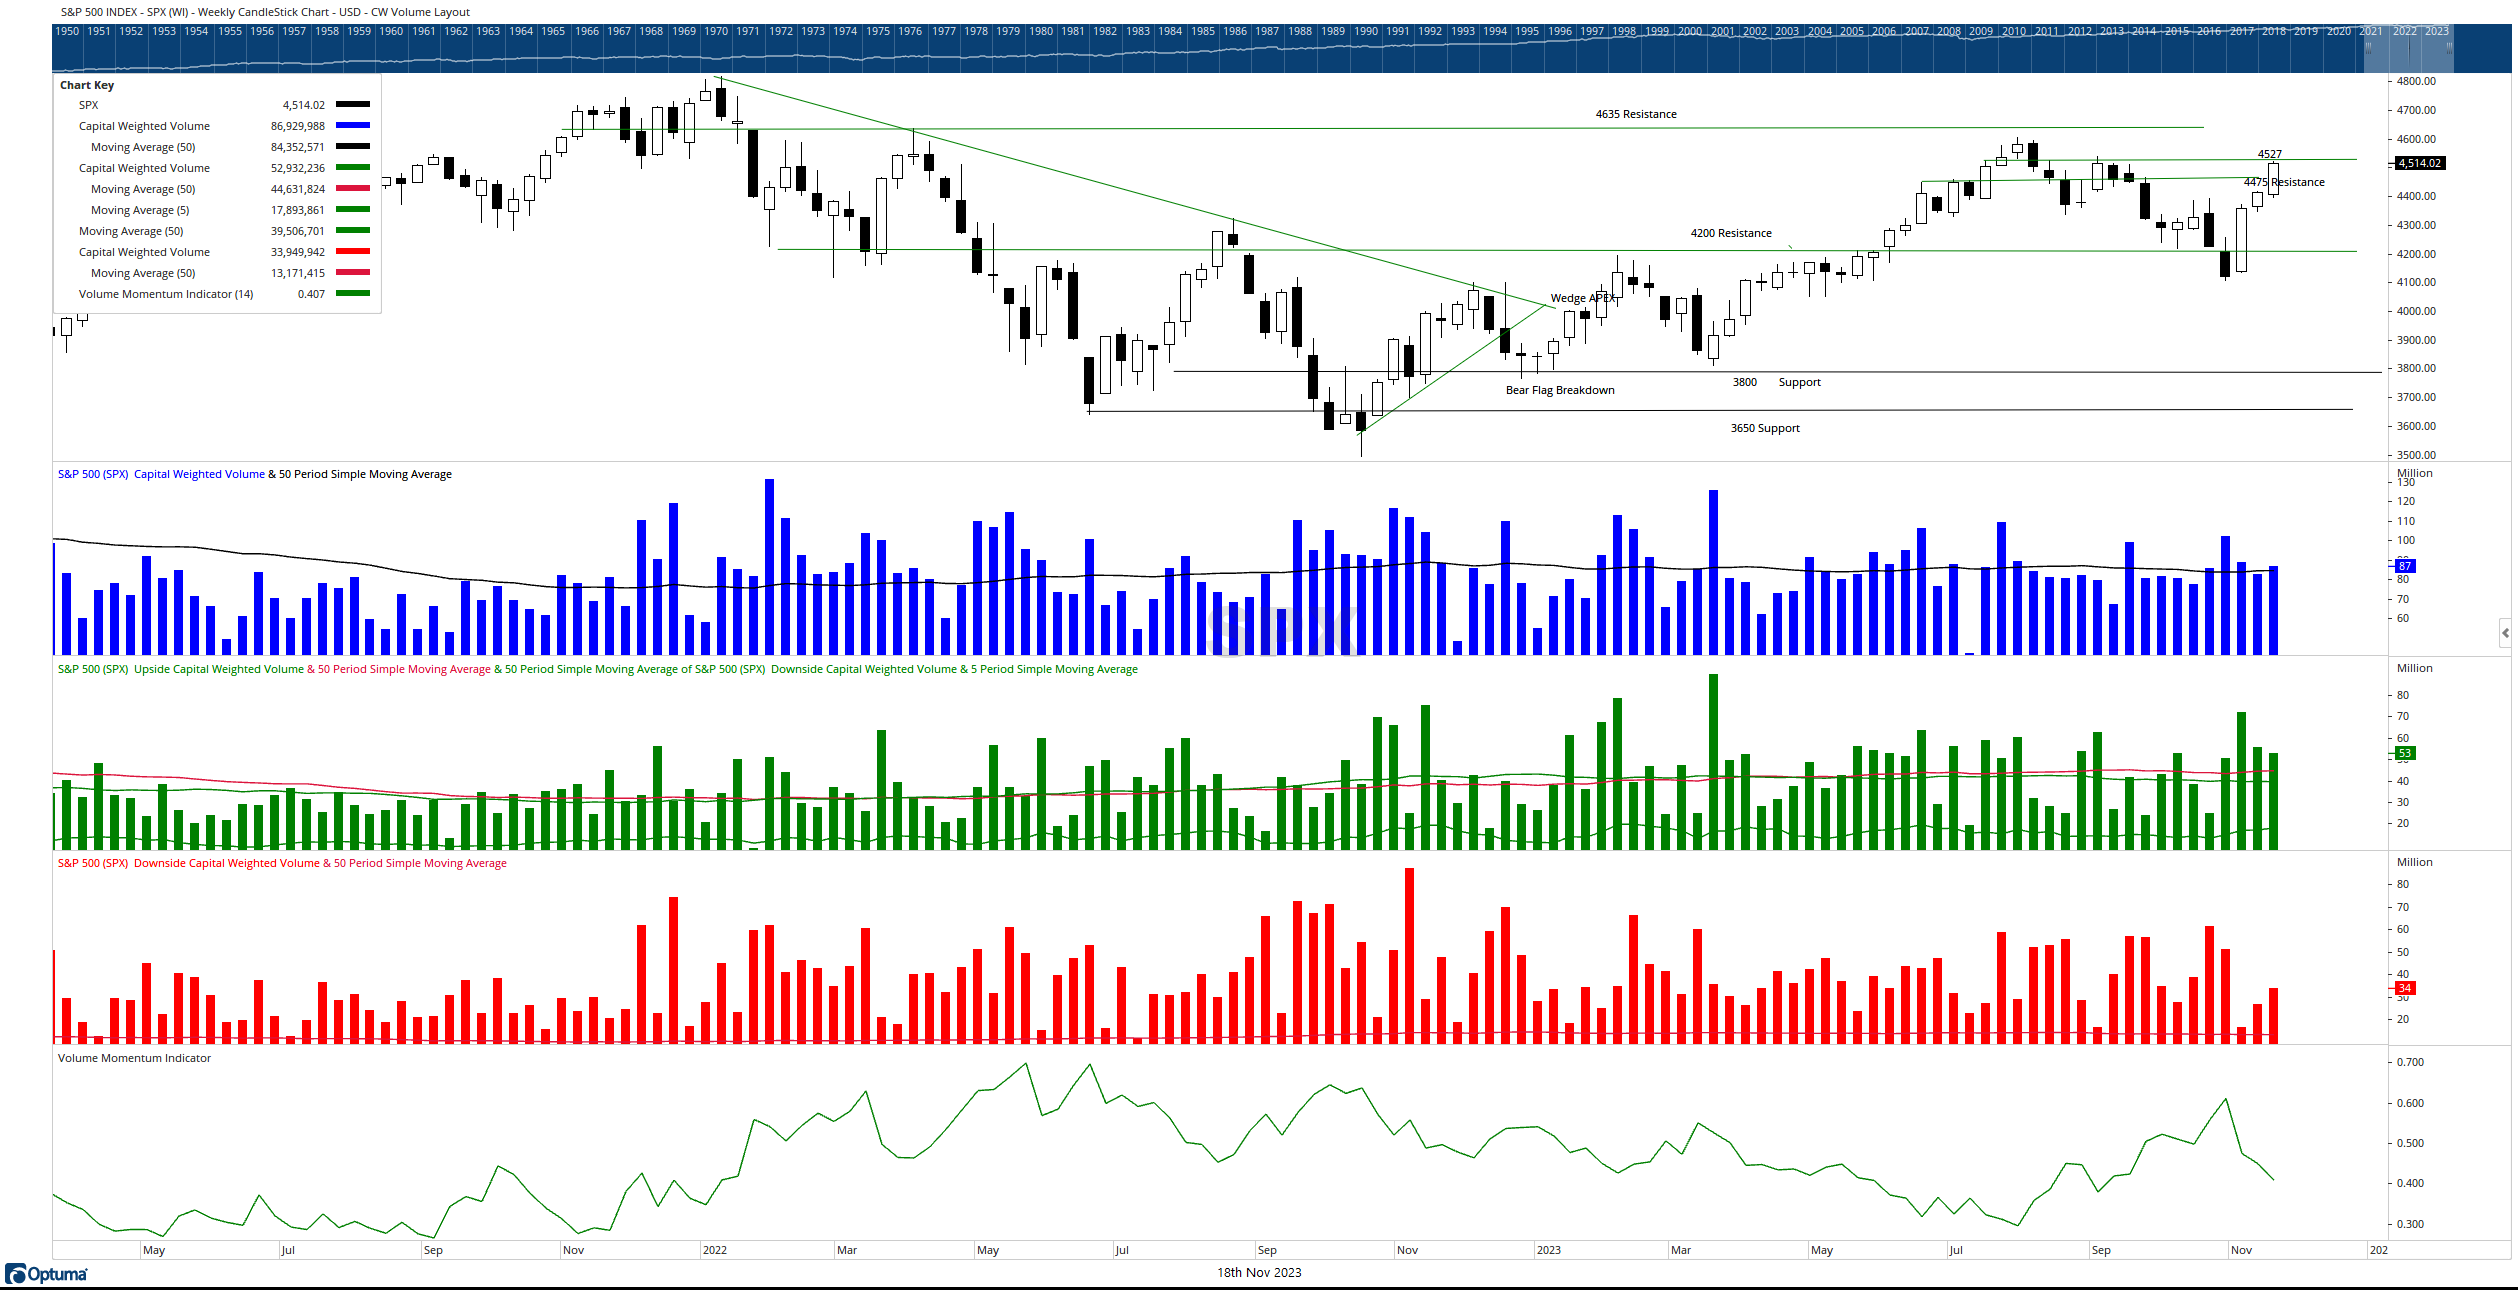
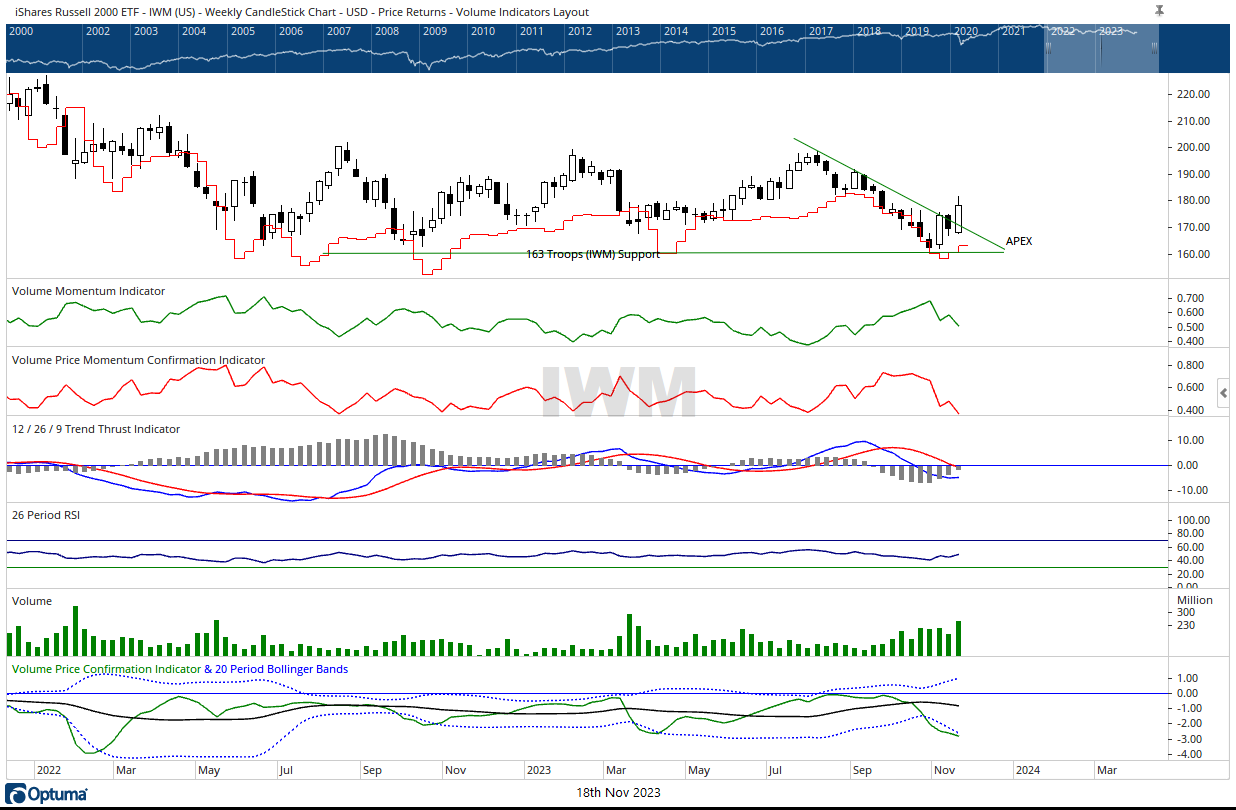
Despite recent fluctuations in the troop’s performance, there may be a positive development on the horizon. The breakout (IWM) bounce against long-term support observed last week may signify the formation of a rare bullish descending triangle. Typically considered a bearish formation, the crucial factor lies in the direction of the move at the apex, whether it’s a breakout or breakdown with high-volume conviction. In the case of IWM, it broke above its downtrend on significant volume. Moreover, this move was substantiated by positive breadth, with the Advance-Decline Line surpassing its previous near-term range.
Looking ahead, S&P 500 resistance resides at 4527 and support rests at 4475. Perhaps more importantly, IWM resistance dwells @ 190 with critical support found at 160.
Shared content and posted charts are intended to be used for informational and educational purposes only. CMT Association does not offer, and this information shall not be understood or construed as, financial advice or investment recommendations. The information provided is not a substitute for advice from an investment professional. CMT Association does not accept liability for any financial loss or damage our audience may incur.
