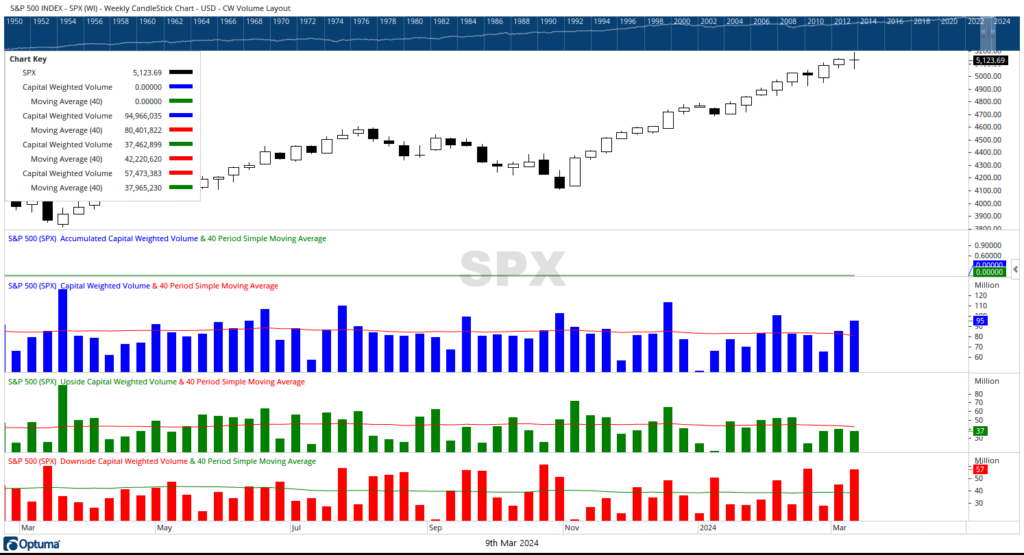
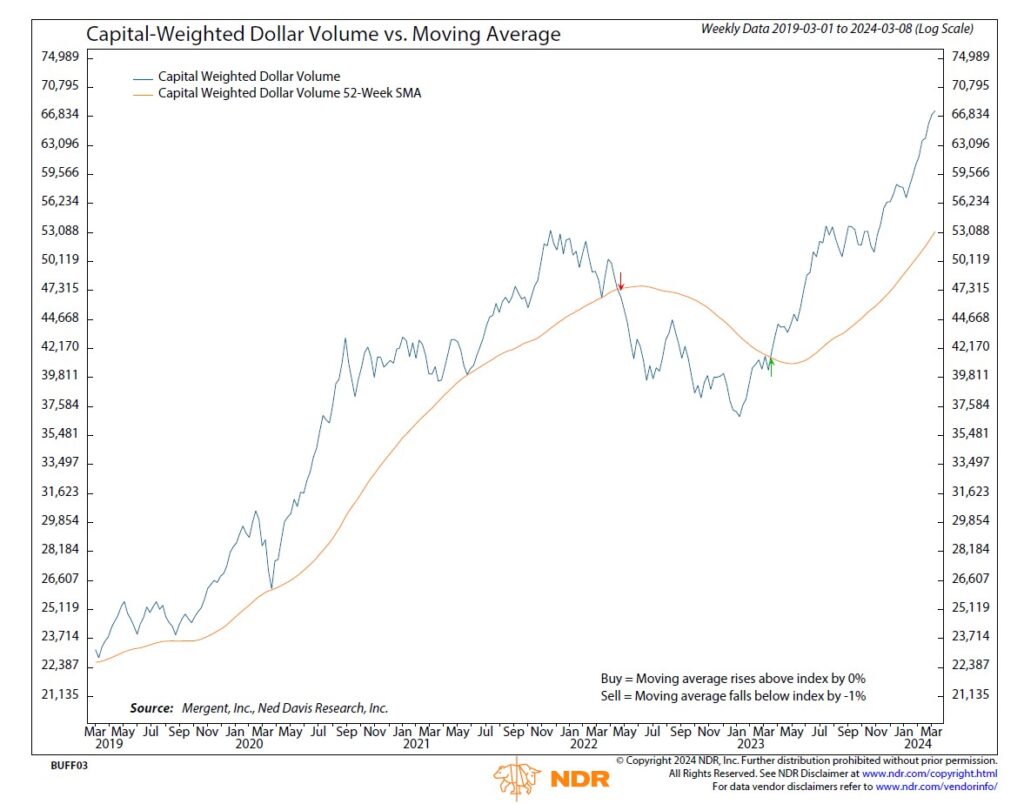
- This past week, capital outflows exceeded inflows with $57.5 billion flowing out versus only $37.5 billion in
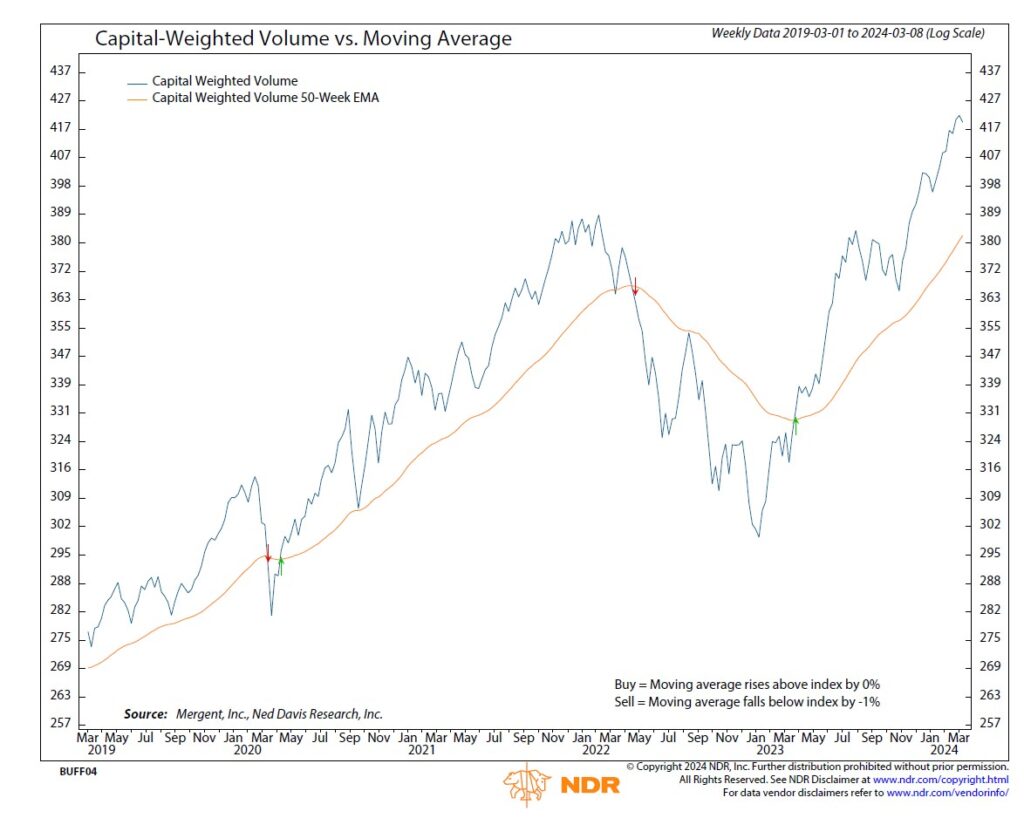
- Capital Weighted Volume also took a breather with a slight downturn but remains largely in an uptrend
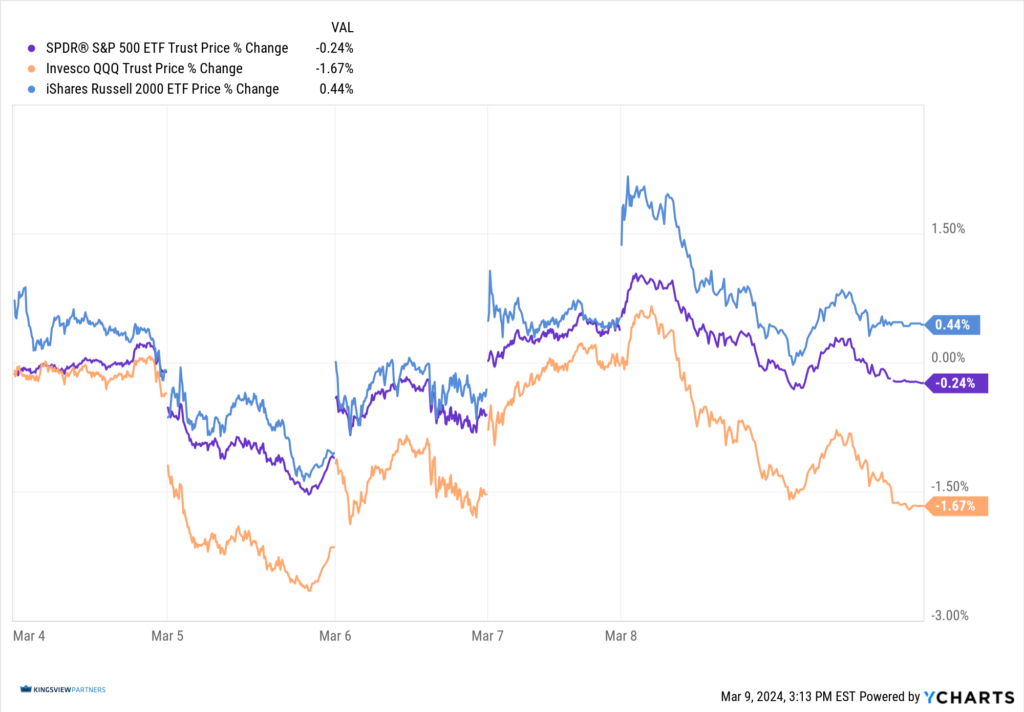
- The generals (Invesco QQQ Trust ETF) lost ground once again this week, finishing down -1.67%
- However, the troops (iShares Russell 2000 […]
This past week, capital outflows exceeded inflows with $57.5 billion flowing out versus only $37.5 billion in. Capital Weighted Volume also took a breather with a slight downturn but remains largely in an uptrend. The generals (Invesco QQQ Trust ETF) lost ground once again this week, finishing down -1.67%. However, the troops (iShares Russell 2000 ETF) edged slightly deeper into resistance, closing up 0.44%. Meanwhile, the S&P 500 faltered slightly, down by -0.24%.
“Doji” notice the signs provided by the stock market this week? When a market breaks out of its upper and lower range only to close approximately at the same level where it began, it is referred to as a “Doji cross or star” in Japanese candlestick analysis. Both the S&P 500 and the troops formed Doji stars on their weekly charts last week.
Doji stars are not necessarily bullish or bearish. Rather, the expectation from a doji star is a pause in the prevailing trend. Dojis may indicate parity building between the forces of supply (bears) and demand (bulls). Because the S&P 500 is in an upward trend, it’s Doji star may suggest a breather is needed before resuming its upward trajectory. Unlike the upward-trending S&P 500, the troops have been stuck in a sideways consolidation pattern. Although the troops’ intermediate trend is sideways, its short-term trend is upward. Given that the troops are bumping up against resistance, the implication of the doji star could suggest a short-term pause in IWM’s test of resistance. Thus, the doji cross in the S&P 500 could imply a pause in the larger intermediate-term trend and a temporary halt to the short-term assault of resistance with IWM.
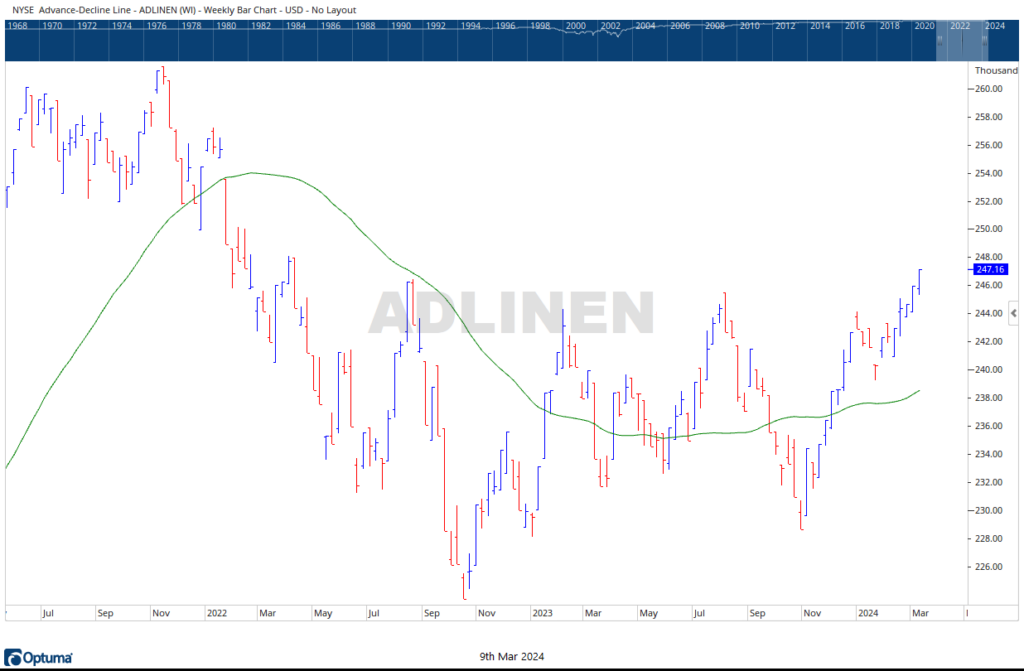
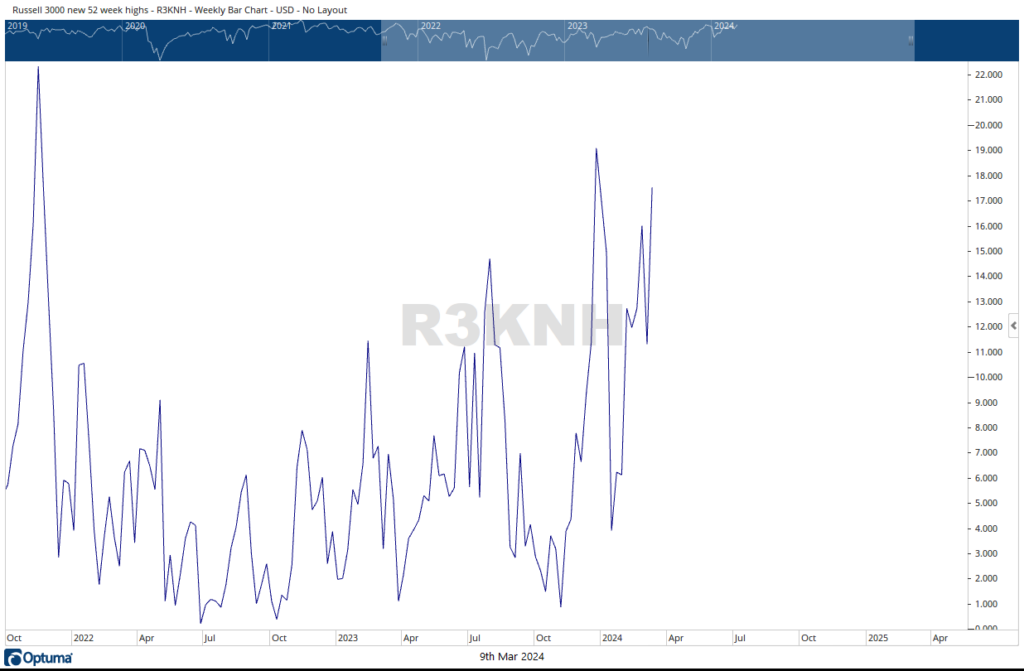
Meanwhile, although market breadth has been our biggest laggard, more recently, it has shown signs of improvement. The NYSE Advance-Decline continued its upward move this past week after reaching a new 2024 yearly high the previous week. Additionally, the number of stocks in the Russell 3000 is also testing its highs for the year.
Grace and peace my friends,
BUFF DORMEIER, CMT®
Updated: 3/11/2024.Historical references do not assume that any prior market behavior will be duplicated. Past performance does not indicate future results. This material has been prepared by Kingsview Wealth Management, LLC. It is not, and should not, be regarded as investment advice or as a recommendation regarding any particular security or course of action. Opinions expressed herein are current opinions as of the date appearing in this material only. All investments entail risks. There is no guarantee that investment strategies will achieve the desired results under all market conditions and each investor should evaluate their ability to invest for the long term. Investment advisory services offered through Kingsview Wealth Management, LLC (“KWM”), an SEC Registered Investment Adviser.
Shared content and posted charts are intended to be used for informational and educational purposes only. CMT Association does not offer, and this information shall not be understood or construed as, financial advice or investment recommendations. The information provided is not a substitute for advice from an investment professional. CMT Association does not accept liability for any financial loss or damage our audience may incur.
