- And Then There Were None Part VII Last week, the markets started out deep in the gutter, with the market heavily oversold
- This oversold condition was evident from a VIX intraday high of 65 (the highest level since the pandemic), weakening sentiment, and my professional favorite, surging volume in the SPY ETF
- All of these […] The post Volume Analysis | Flash Market Update – 8.12.24 appeared first on Kingsview .
And Then There Were None Part VII
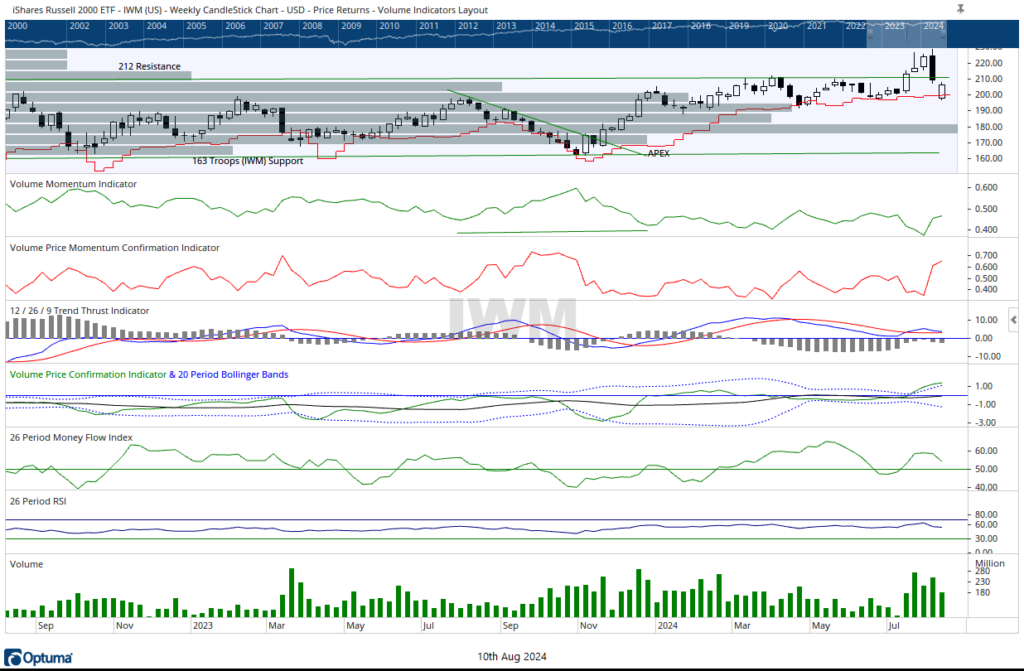
Last week, the markets started out deep in the gutter, with the market heavily oversold. This oversold condition was evident from a VIX intraday high of 65 (the highest level since the pandemic), weakening sentiment, and my professional favorite, surging volume in the SPY ETF. All of these indications pointed towards short-term capitulation conditions. By the end of the week, the S&P 500 largely erased its losses, closing down just 0.04%. The generals (Nasdaq 100) capitalized on Monday’s deeply oversold state to resurrect their former leadership, finishing up 0.39%. Meanwhile, the broader markets didn’t fare quite as well. The troops (IWM Russell 2000 ETF) finished down 1.18%, and the Schwab Dividend ETF closed the week down 0.78%.
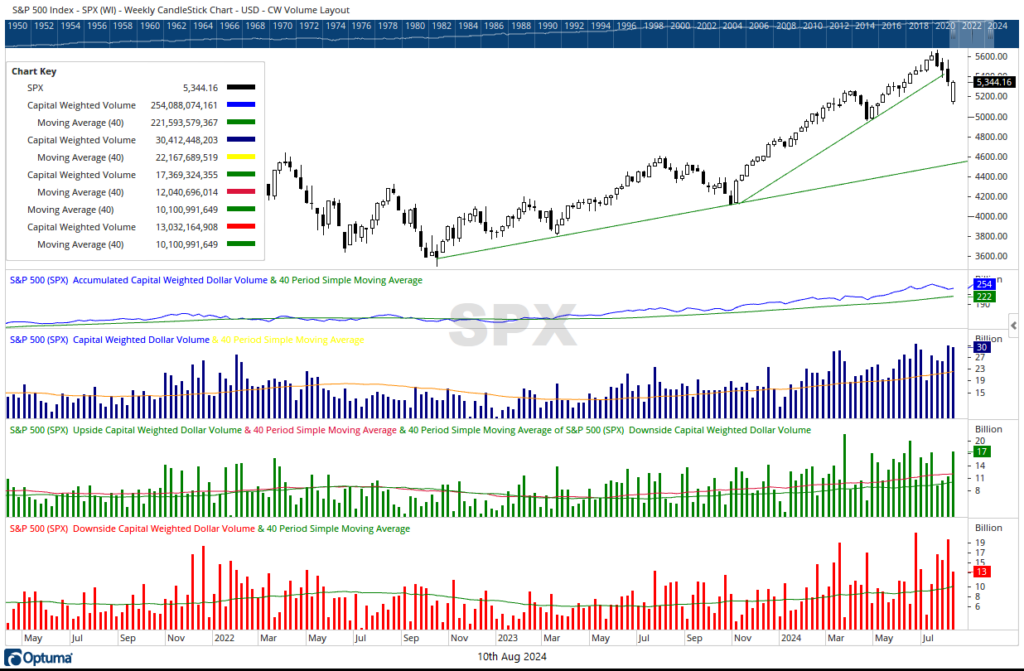
In our “ And Then There Were None Part II “ commentary at the end of June, we alluded to flash crash conditions emerging with these comments: “Under the surface, last week the broad markets appeared dull and lifeless; nevertheless, internally strong forces were once again lively at work. Two weeks ago, we witnessed the highest capital-weighted volume in the S&P 500 since the pandemic bottom. Although the S&P was up for the week, 70% of the volume was to the downside. This past week, capital flows were once again extraordinarily high, just slightly below the previous week’s massive surge. A similar phenomenon occurred three weeks before the flash crash: massive downside volume on muted price changes. So, what does this high downside volume and muted price change infer? Imagine you are a very large institution that desires to quickly de-risk or rotate allocations. It would be difficult to scale down your weak mid and small caps without forcing down the prices from your operations. So instead, you might consider selling your most liquid stocks—the mega caps.” Reporting on Monday’s sell-off, CNBC reporter Bob Pasiani described Monday’s manic market action in his article titled “A guide to the wild week of trading, from Monday’s ‘flash crash’ to the yen to the volatility spike.”
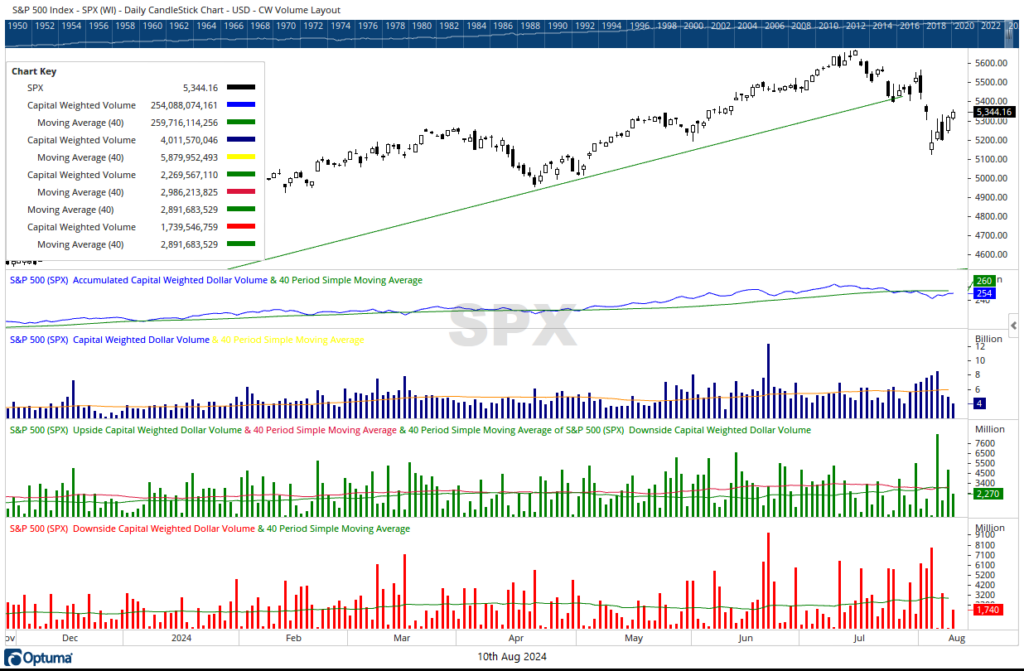
Despite the price recovery occurring on the surface, the bears shifted the internal equilibrium balance of power in volume terms. Monday’s volume was high, with over 99% of the trades to the downside by dollar volume—one of the highest disproportions I can recall. Tuesday saw a rebound on slightly higher volume, with approximately 82% of the dollar volume trades to the upside. On Thursday, the bulls scored a 90% dollar volume upside day. However, the trading was on low volume, significantly minimizing the impact.
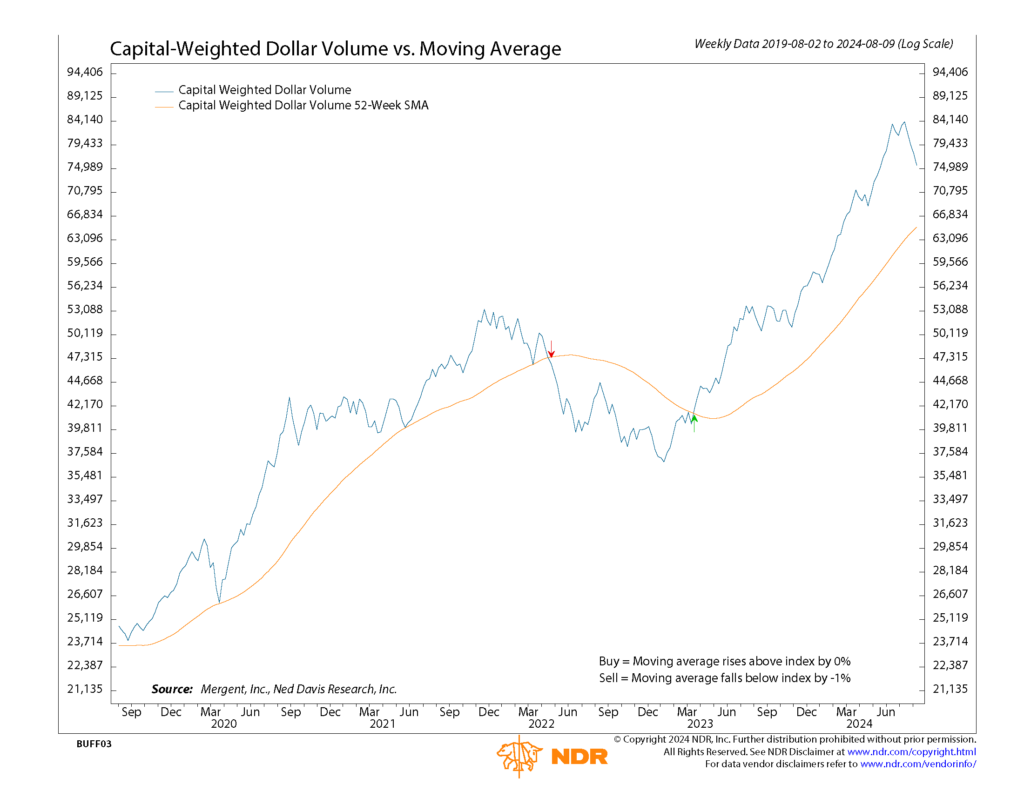
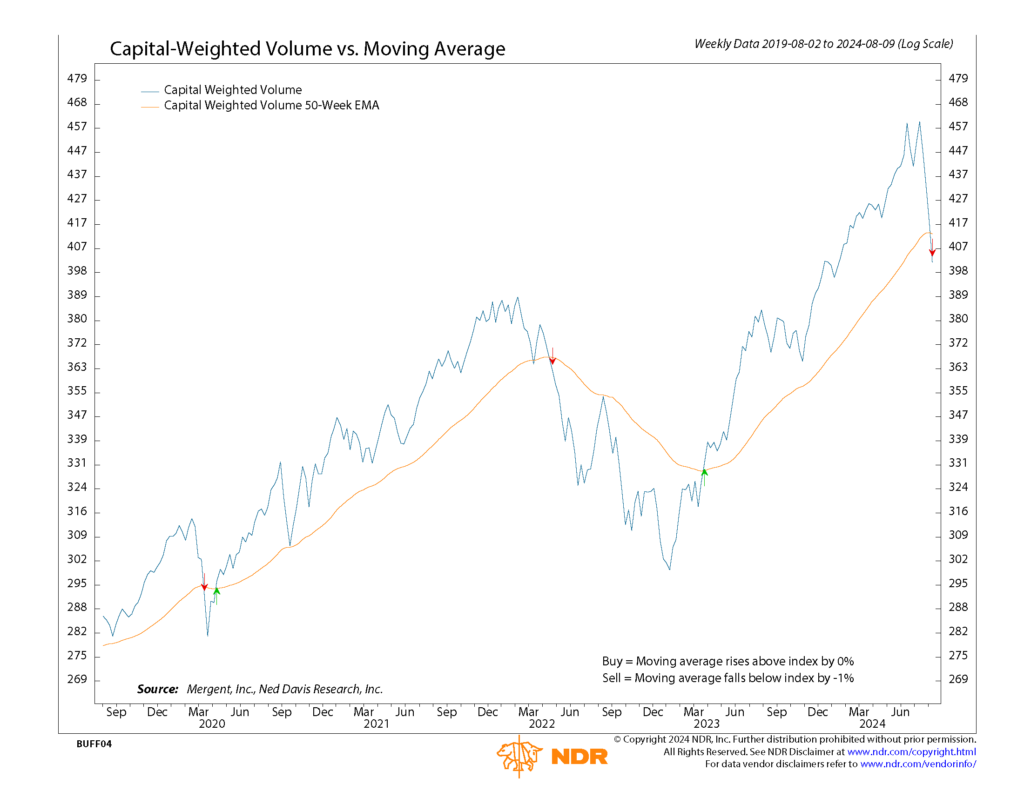
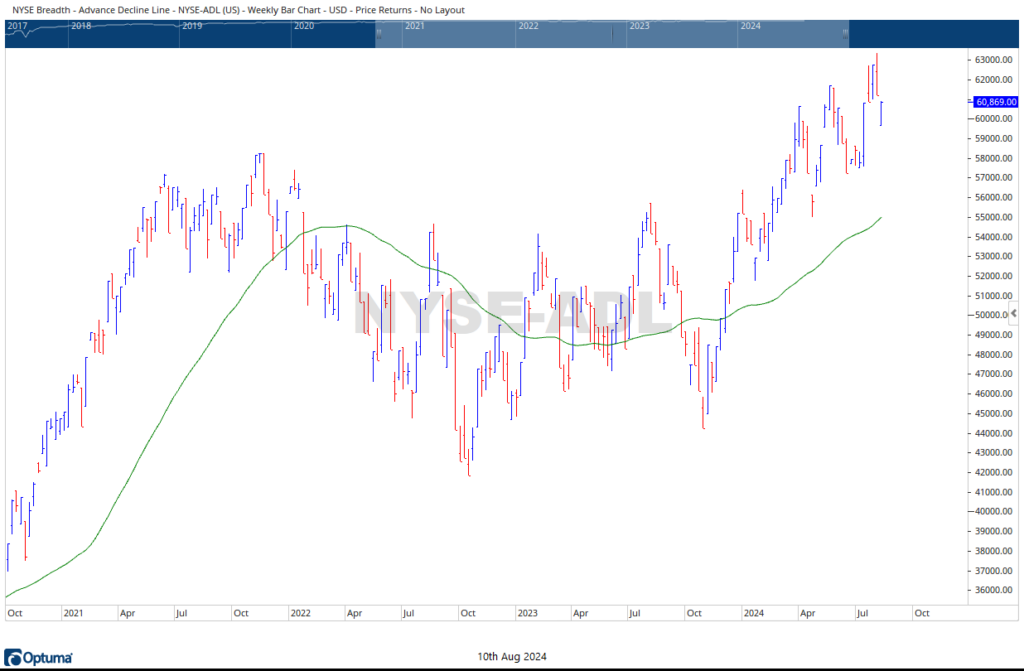
Notably, the most significant event of the week from a volume analysis perspective was the continued nosedive in Capital-Weighted Volume, now breaking below its intermediate trends. Such an occurrence is one of the three levers defining a Volume Analysis Bear Market and the one I deem as most important. Capital-Weighted Dollar Volume also dropped meaningfully on the week but remains above trend. However, the final lever, the NYSE Advance-Decline Line, rebounded from Monday’s crash to finish just slightly lower than the previous week’s lows. This is an interesting development, as the Advance-Decline Line is typically the first indicator to warn of bear market conditions and was very late in confirming the bull market. This relatively stronger behavior in the Advance- Decline Line may support our earlier thesis of market rotation.
Let’s conclude by identifying important potential events to watch as the upcoming week and month unfold. The S&P 500 has critical support at 5000, with intermediate support at 5100. The crucial area to watch is S&P 5500 trendline resistance. Currently, the S&P 500 is range-bound, but breaking above 5500 soon would put it back in an uptrend. The troops (IWM ETF) need to hold above 197 support to stay in the upper half of their range, while a break above 112 resistance would restore the bullish breakout for the troops.
Grace and peace my friends,
BUFF DORMEIER, CMT

Updated: 8/12/2024. Historical references do not assume that any prior market behavior will be duplicated. Past performance does not indicate future results. This material has been prepared by Kingsview Wealth Management, LLC. It is not, and should not, be regarded as investment advice or as a recommendation regarding any particular security or course of action. Opinions expressed herein are current opinions as of the date appearing in this material only. All investments entail risks. There is no guarantee that investment strategies will achieve the desired results under all market conditions and each investor should evaluate their ability to invest for the long term. Investment advisory services offered through Kingsview Wealth Management, LLC (“KWM”), an SEC Registered Investment Adviser.
The post Volume Analysis | Flash Market Update – 8.12.24 appeared first on Kingsview.
Shared content and posted charts are intended to be used for informational and educational purposes only. CMT Association does not offer, and this information shall not be understood or construed as, financial advice or investment recommendations. The information provided is not a substitute for advice from an investment professional. CMT Association does not accept liability for any financial loss or damage our audience may incur.