- And Then There Were None Part VIII – Return of the Generals The generals (Nasdaq 100) roared back this week, pulling other markets up with them
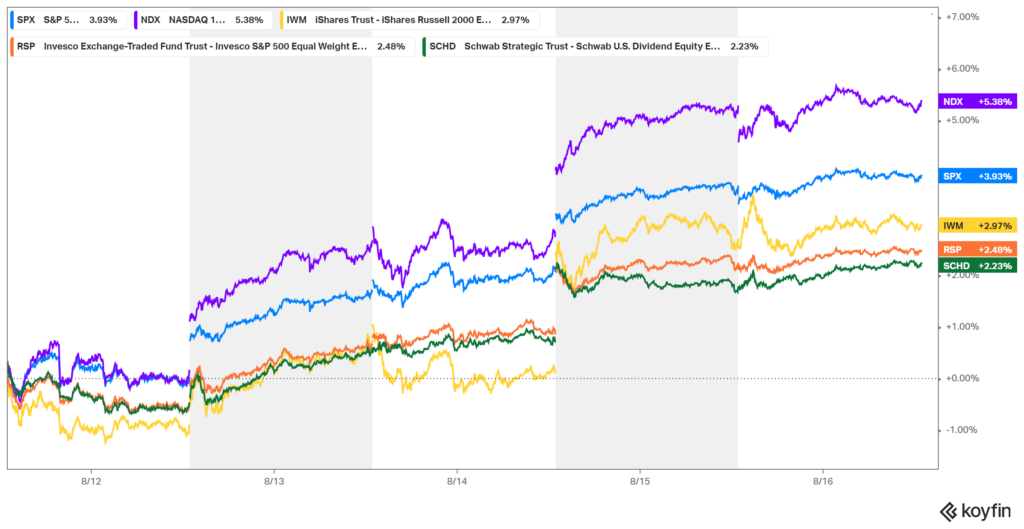
- The generals finished up 5.38%, the S&P 500 rose 3.93%, and the troops (iShares Russell 2000 ETF, IWM) gained 2.97%
- Rounding out the bull run, the Invesco S&P 500 […] The post Volume Analysis | Flash Market Update – 8.19.24 appeared first on Kingsview .
And Then There Were None Part VIII – Return of the Generals
The generals (Nasdaq 100) roared back this week, pulling other markets up with them. The generals finished up 5.38%, the S&P 500 rose 3.93%, and the troops (iShares Russell 2000 ETF, IWM) gained 2.97%. Rounding out the bull run, the Invesco S&P 500 Equal Weight ETF (RSP) finished the week up 2.48%, while dividend stocks represented by the Schwab US Dividend Equity ETF (SCHD) increased 2.23%. This rally was set up by deeply oversold conditions, including sharply elevated volatility (VIX Index above 65 on August 5th, the highest since the pandemic) and surging volume in the SPDR S&P 500 ETF Trust (SPY), creating the necessary conditions for our proprietary VPCI V Bottom.
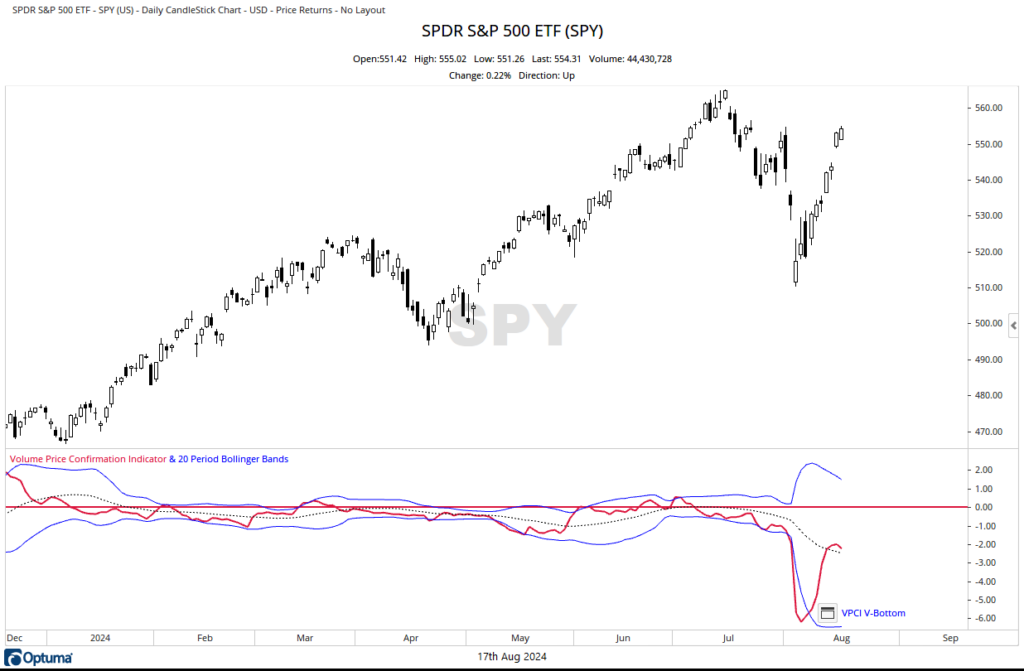
The VPCI (Volume Price Confirmation Indicator) V Bottom is our trademark volume sentiment indicator used on SPY. The VPCI calculates the asymmetry between price trends and their corresponding volume, whereas sentiment indicators help identify market extremes. Think of it this way: Do you know anyone who’s always right? Probably not, but you undoubtedly know several people who have a knack for seemingly doing the wrong thing at precisely the wrong time. We have a symbol to track these investors who buy on greed and the fear of missing out. These same people inevitably tend to sell on fear and panic. What ticker is it? You betcha, it’s SPY. SPY mirrors the S&P 500 in price, but we focus on SPY’s volume. During bear market bottoms, SPY’s volume tends to skyrocket as the market tanks. What we are looking for is SPY’s VPCI to drop 2 standard deviations below its lower Bollinger Band. This is one of the conditions we look for in identifying VPCI washout bottom conditions. This part of the setup occurred on Friday, August 2nd, indicating that weak-handed investors might be selling out. The reentry trigger occurs when the VPCI turns back up crossing over its lower Bollinger Band, which occurred on Wednesday, August 7th, two days after Monday’s low (more on this next week), suggesting that weaker investors may have capitulated, possibly setting up favorable conditions for the bulls.
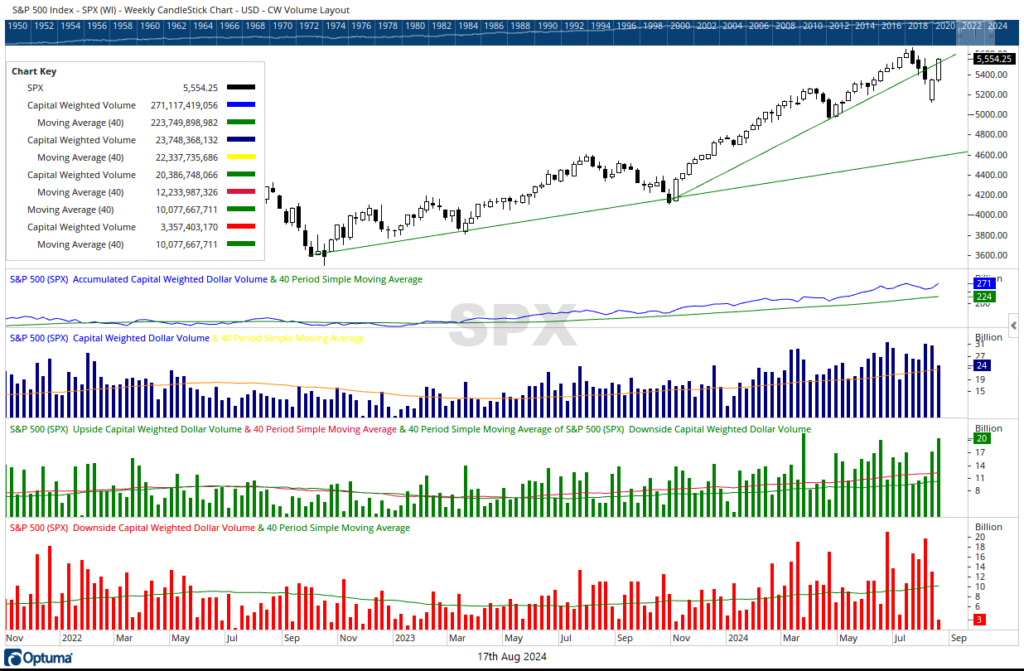
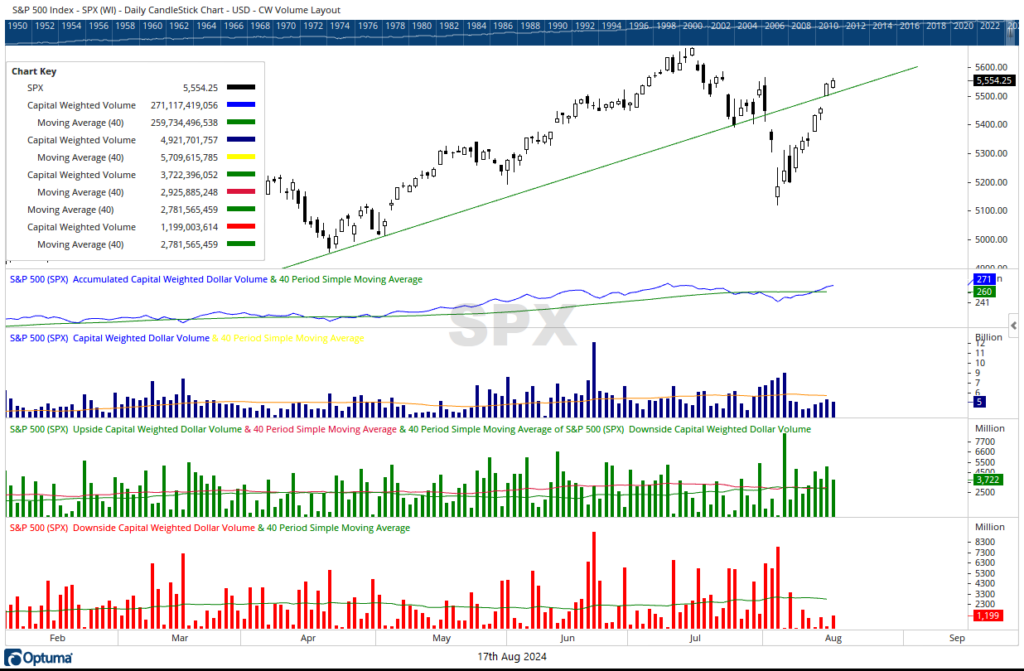
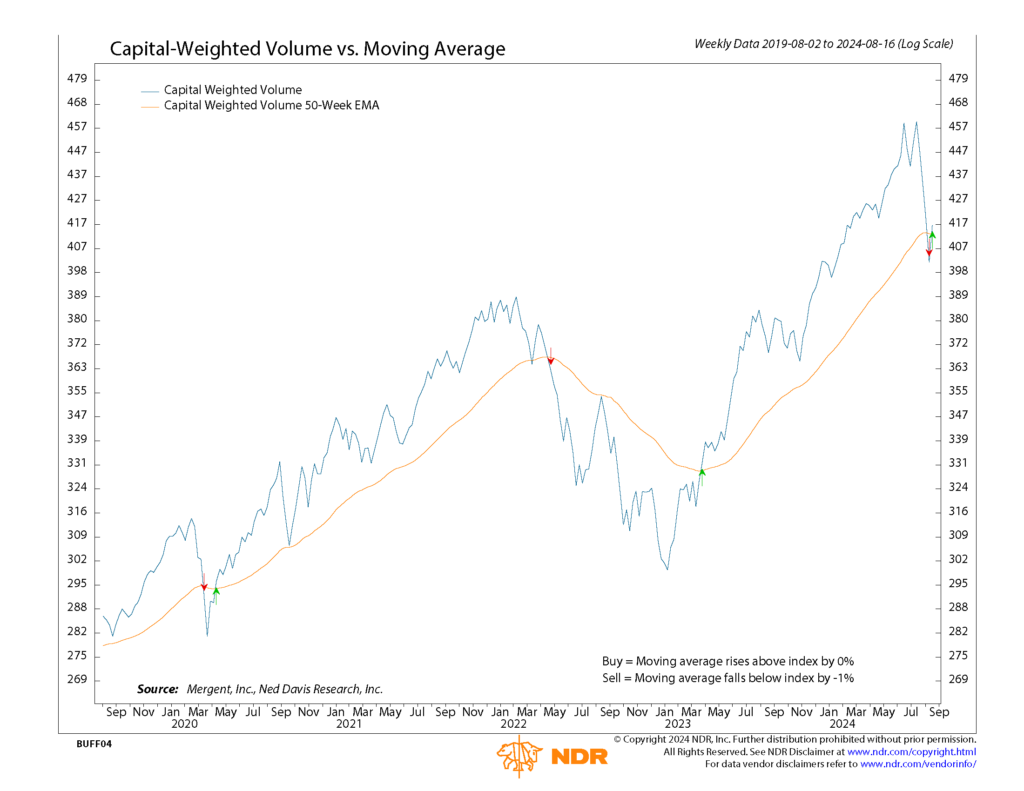
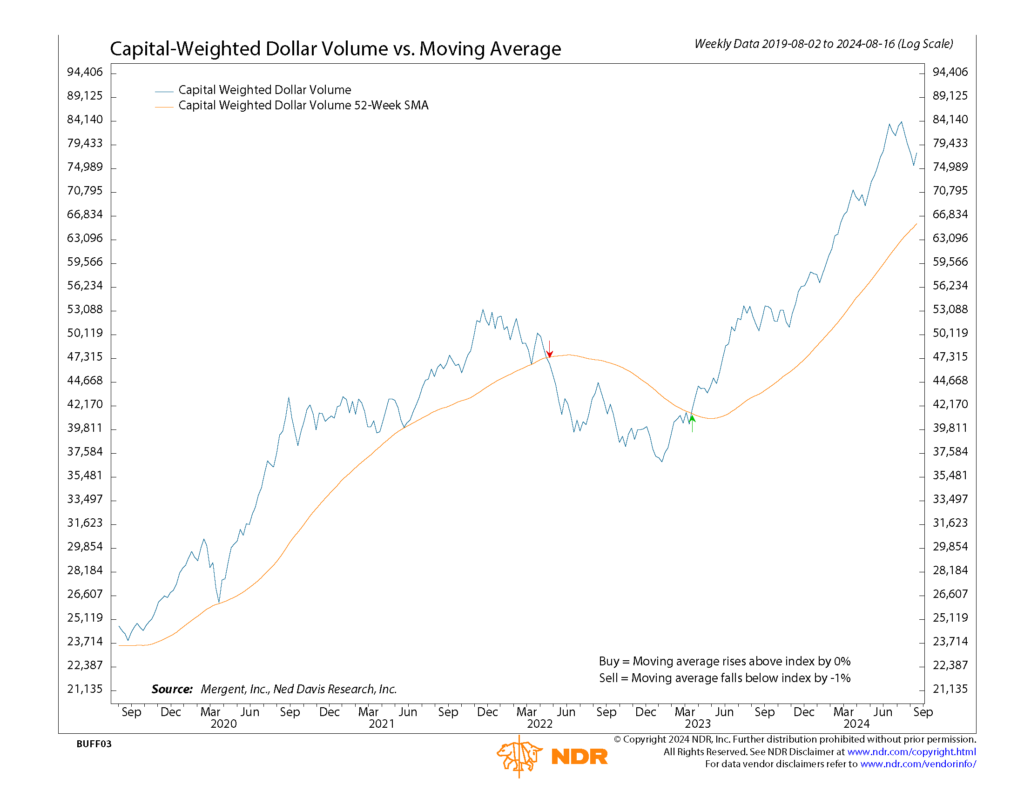
The generals’ rocket recovery was fueled on ultra-high upside dollar volume, as demonstrated by two 90% S&P 500 upside dollar volume days on Tuesday, August 13th and Thursday, August 15th. The week’s surge occurred on remarkably one-sided volume, with 85% of the weekly volume on the upside. Although the volume was heavily skewed to the upside, it wasn’t abnormally high. However, it was strong enough to push Capital Weighted Volume back above trend, reversing last week’s trend violation, albeit just barely.
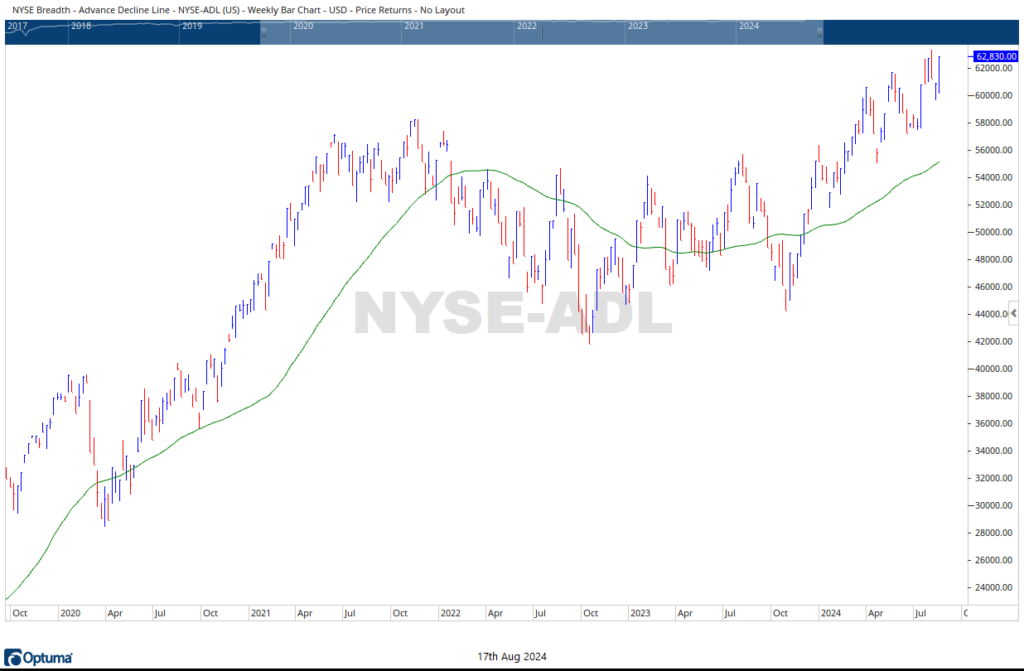
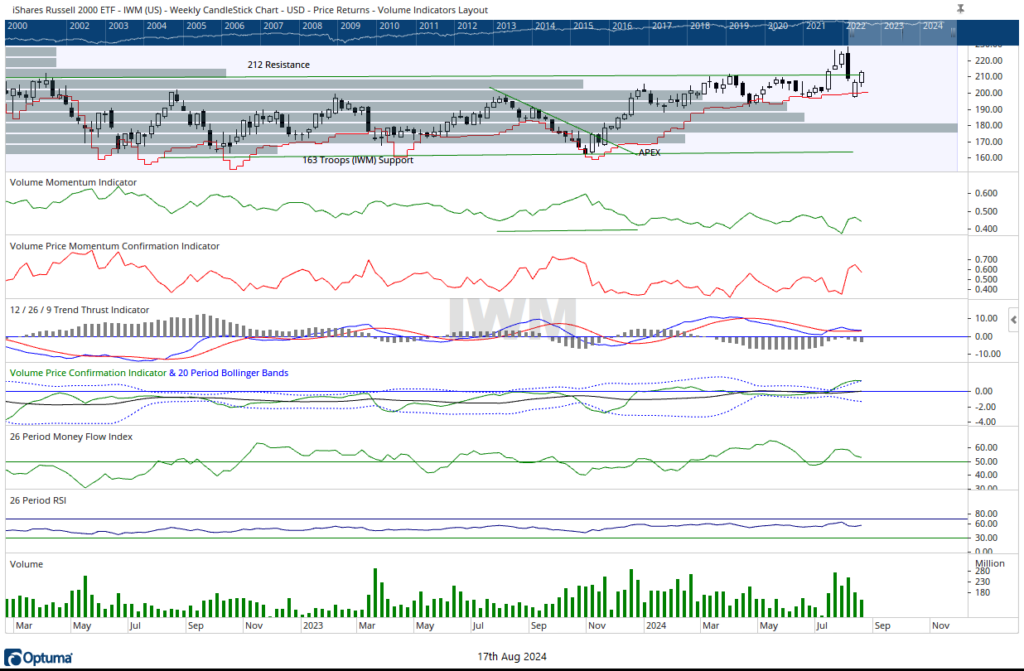
IWM narrowly closed above its 212 resistance, showing strength. Market breadth was even stronger, with the NYSE Advance-Decline Line nearing all-time highs once again. These market behaviors may represent a positive development for the troops and the rotation trade. Overall, blasting off the VPCI V Bottom, the market continued its revival this past week. Both the troops and the generals, along with the S&P 500, now find themselves in congestion zones of resistance. Meanwhile, the volume internals are becoming increasingly mixed. The action over the next few weeks could help us determine whether recent action is a resumption of the long-term trend or just a bounce off oversold conditions.
Grace and peace my friends,
BUFF DORMEIER, CMT
Updated: 8/19/2024. Historical references do not assume that any prior market behavior will be duplicated. Past performance does not indicate future results. This material has been prepared by Kingsview Wealth Management, LLC. It is not, and should not, be regarded as investment advice or as a recommendation regarding any particular security or course of action. Opinions expressed herein are current opinions as of the date appearing in this material only. All investments entail risks. There is no guarantee that investment strategies will achieve the desired results under all market conditions and each investor should evaluate their ability to invest for the long term. Investment advisory services offered through Kingsview Wealth Management, LLC (“KWM”), an SEC Registered Investment Adviser.
The post Volume Analysis | Flash Market Update – 8.19.24 appeared first on Kingsview.
Shared content and posted charts are intended to be used for informational and educational purposes only. CMT Association does not offer, and this information shall not be understood or construed as, financial advice or investment recommendations. The information provided is not a substitute for advice from an investment professional. CMT Association does not accept liability for any financial loss or damage our audience may incur.