- And Then There Were None Part IX The rotation trade saw a resurgence this past week, with the generals stepping aside as the troops led the charge
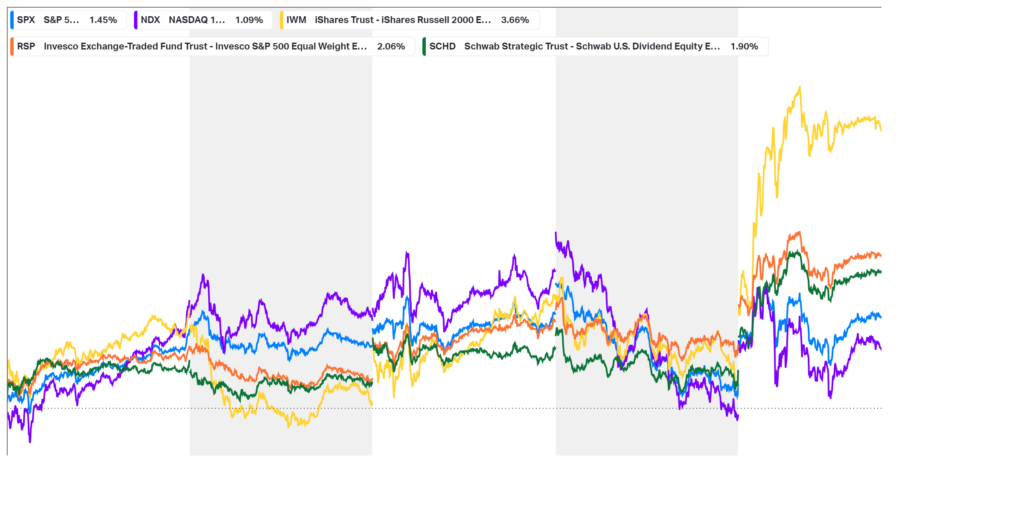
- The troops, represented by the iShares Russell 2000 ETF (IWM), finished up 3.66%, while the generals (NDX) lagged behind, gaining just 1.09%
- Market broadening was further evidenced by […] The post Volume Analysis | Flash Market Update – 8.26.24 appeared first on Kingsview .
And Then There Were None Part IX
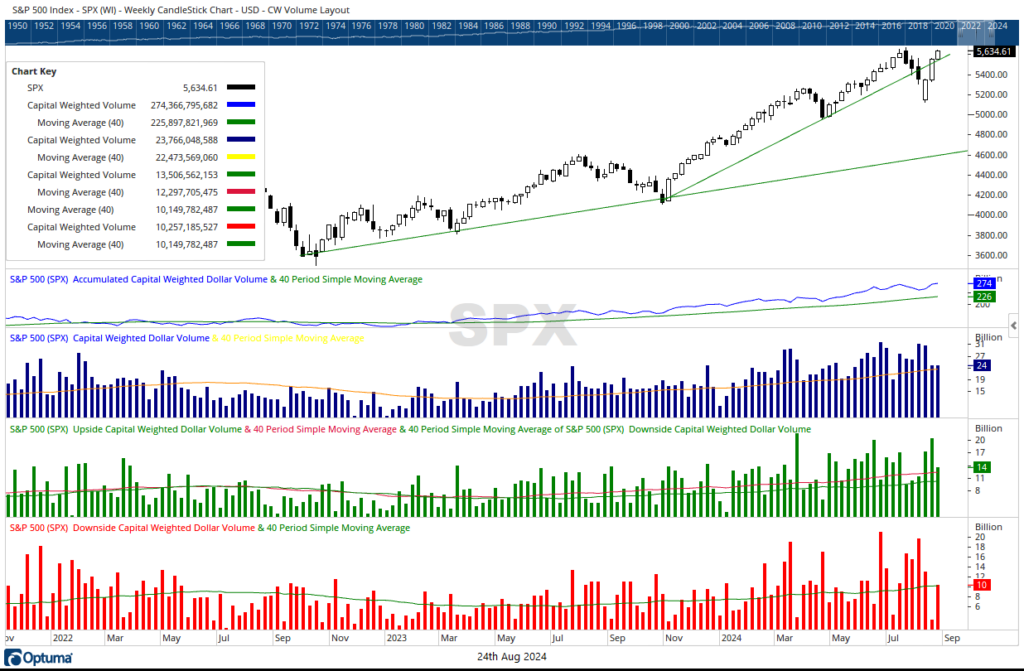
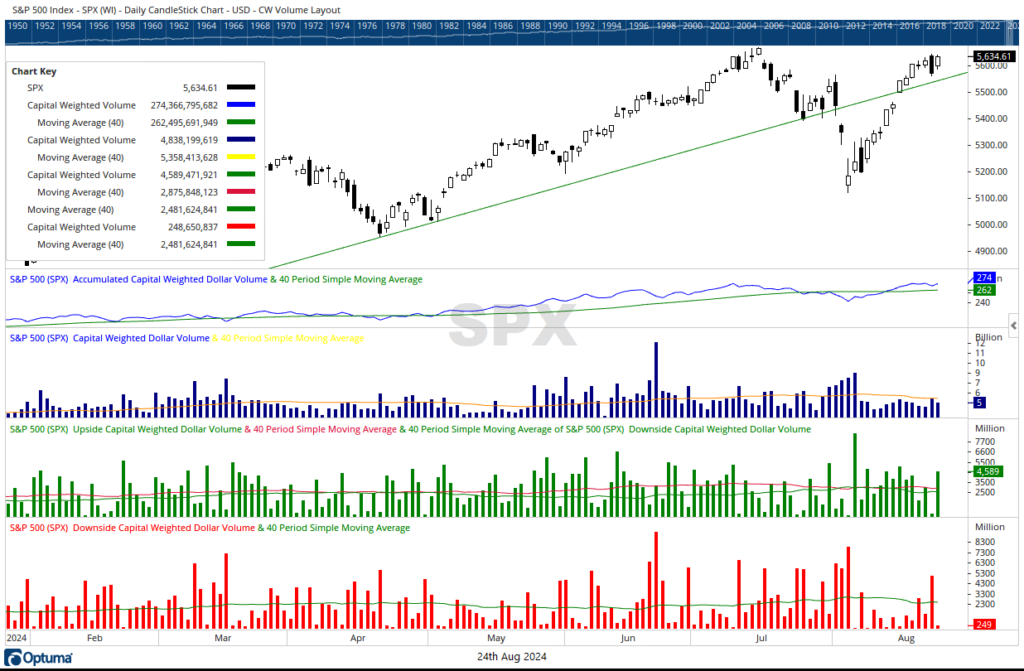
The rotation trade saw a resurgence this past week, with the generals stepping aside as the troops led the charge. The troops, represented by the iShares Russell 2000 ETF (IWM), finished up 3.66%, while the generals (NDX) lagged behind, gaining just 1.09%. Market broadening was further evidenced by the Invesco S&P 500 Equal Weight ETF (RSP), which rose 2.06%, and dividend stocks (Schwab US Dividend Equity ETF, SCHD), which gained 1.90%, both outperforming the capital-weighted S&P 500, which was up 1.45%. Dollar volume was average, with both upside and downside flows hovering around their 40-week averages, totaling $13.5 billion in inflows and $10.25 billion in outflows. Both the bears and bulls each recorded a 10% day. The Bears took control on Thursday, August 22nd, capturing over 90% of the volume to the downside. However, the Bulls reversed course on Friday, August 23rd, claiming 90% of the dollar volume to the upside.
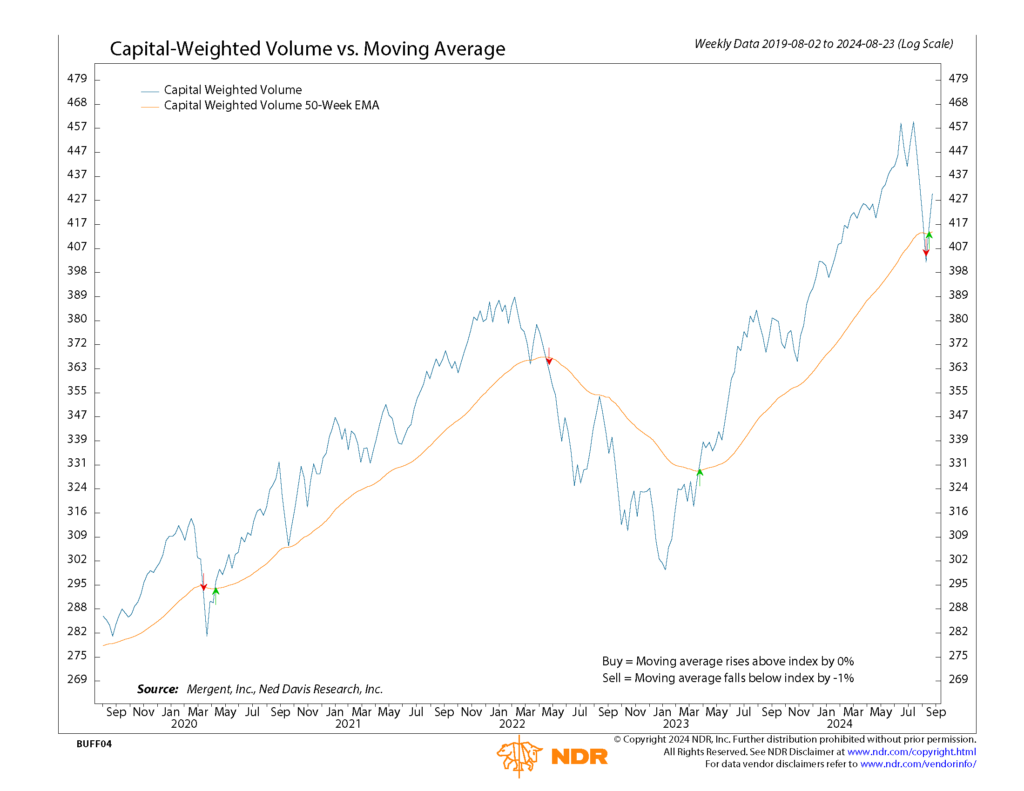
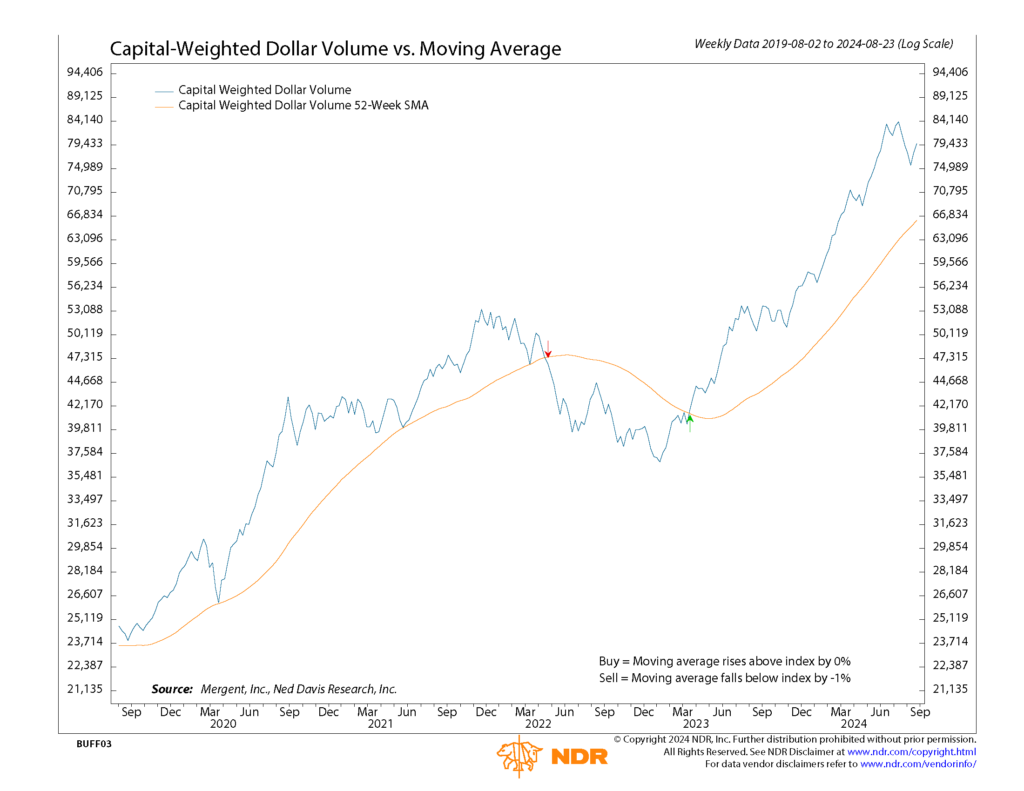
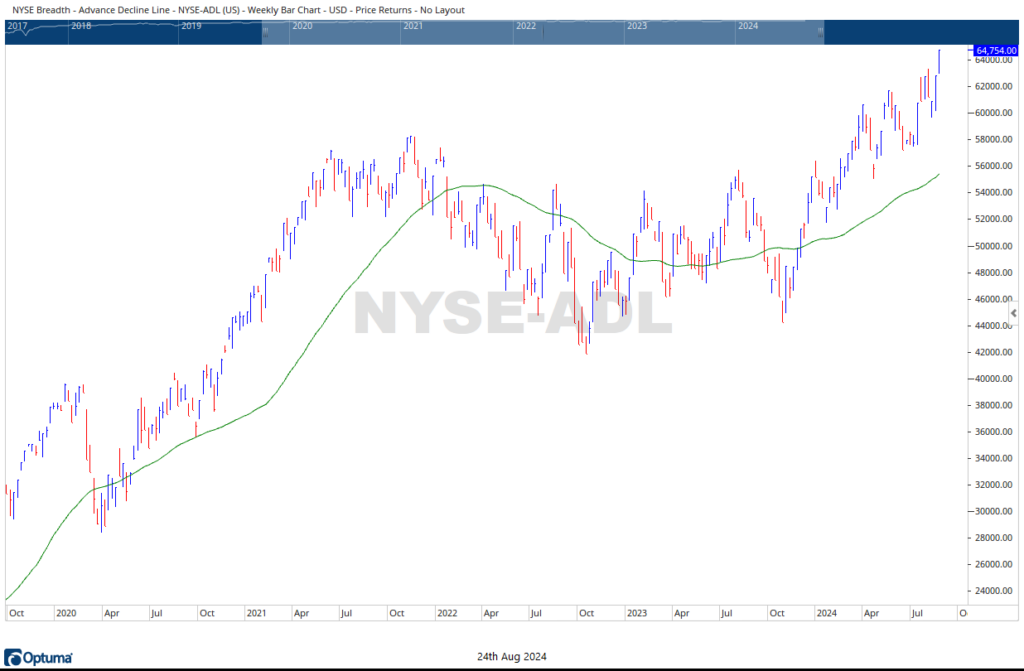
Market breadth continues to expand, with the Advance-Decline Line reaching all-time highs ahead of the S&P 500. Although the S&P 500 Capital Weighted Dollar has led the current market advance from the beginning and remains healthy above trend, it is now lagging behind price. Meanwhile, Capital Weighted Volume, which previously led all markets higher, including the price indexes, the Advance-Decline Line, and Capital Weighted Volume, has now become the laggard. This may be the most concerning sign in an otherwise very healthy market.
Looking ahead, we are entering a weaker cyclical phase of the presidential cycle, which may last until mid-October. The troops have moved back into the high end of their former range, with support at 212 and resistance at 225. The S&P 500 has near-term support at 5550, with resistance at 5650 and then again at the all-time high of 5670.
Grace and peace my friends,
BUFF DORMEIER, CMT
Updated: 8/26/2024. Historical references do not assume that any prior market behavior will be duplicated. Past performance does not indicate future results. This material has been prepared by Kingsview Wealth Management, LLC. It is not, and should not, be regarded as investment advice or as a recommendation regarding any particular security or course of action. Opinions expressed herein are current opinions as of the date appearing in this material only. All investments entail risks. There is no guarantee that investment strategies will achieve the desired results under all market conditions and each investor should evaluate their ability to invest for the long term. Investment advisory services offered through Kingsview Wealth Management, LLC (“KWM”), an SEC Registered Investment Adviser.
The post Volume Analysis | Flash Market Update – 8.26.24 appeared first on Kingsview.
Shared content and posted charts are intended to be used for informational and educational purposes only. CMT Association does not offer, and this information shall not be understood or construed as, financial advice or investment recommendations. The information provided is not a substitute for advice from an investment professional. CMT Association does not accept liability for any financial loss or damage our audience may incur.