| Investopedia is partnering with CMT Association on this newsletter. The contents of this newsletter are for informational and educational purposes only, however, and do not constitute investing advice. The guest authors, which may sell research to investors, and may trade or hold positions in securities mentioned herein do not represent the views of CMT Association or Investopedia. Please consult a financial advisor for investment recommendations and services. |
NVDA Squats
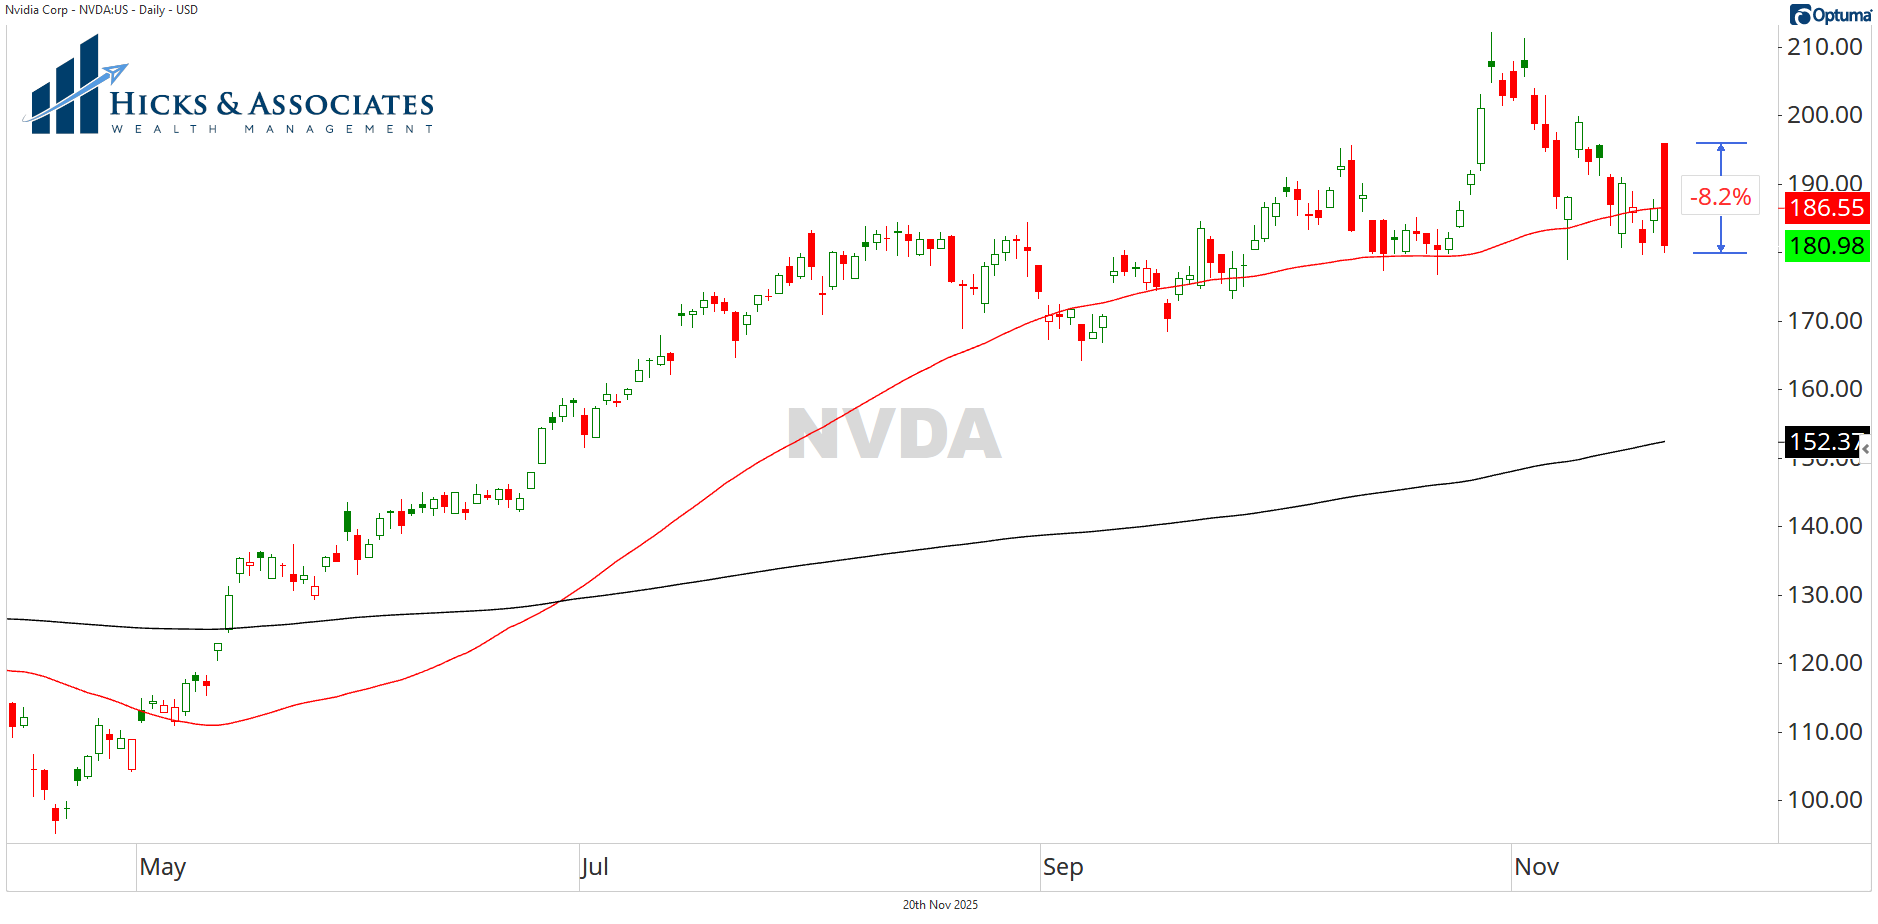
At the open, sheer euphoria. NVDA, once again, delivered! Humanity and the entire stock market has been saved! [Enter the sound of adulation and cheers.]
Well, that didn’t last long.
As soon as NVDA reported earnings, the after-hours trading shot up. But, once the opening bell rang, price really couldn’t hold and the sellers took over. That is one ugly daily candle … and on very high volume too.
A gap higher at the open, and then an ~8% squat. I’m gonna call that not normal. At least it’s not normal healthy behavior.
But read on, you’ll love the last chart today.
Small Cap Downtrend
There are so many charts I could show you right now that posted really ugly candles on Thursday. And they don’t look like normal healthy action.
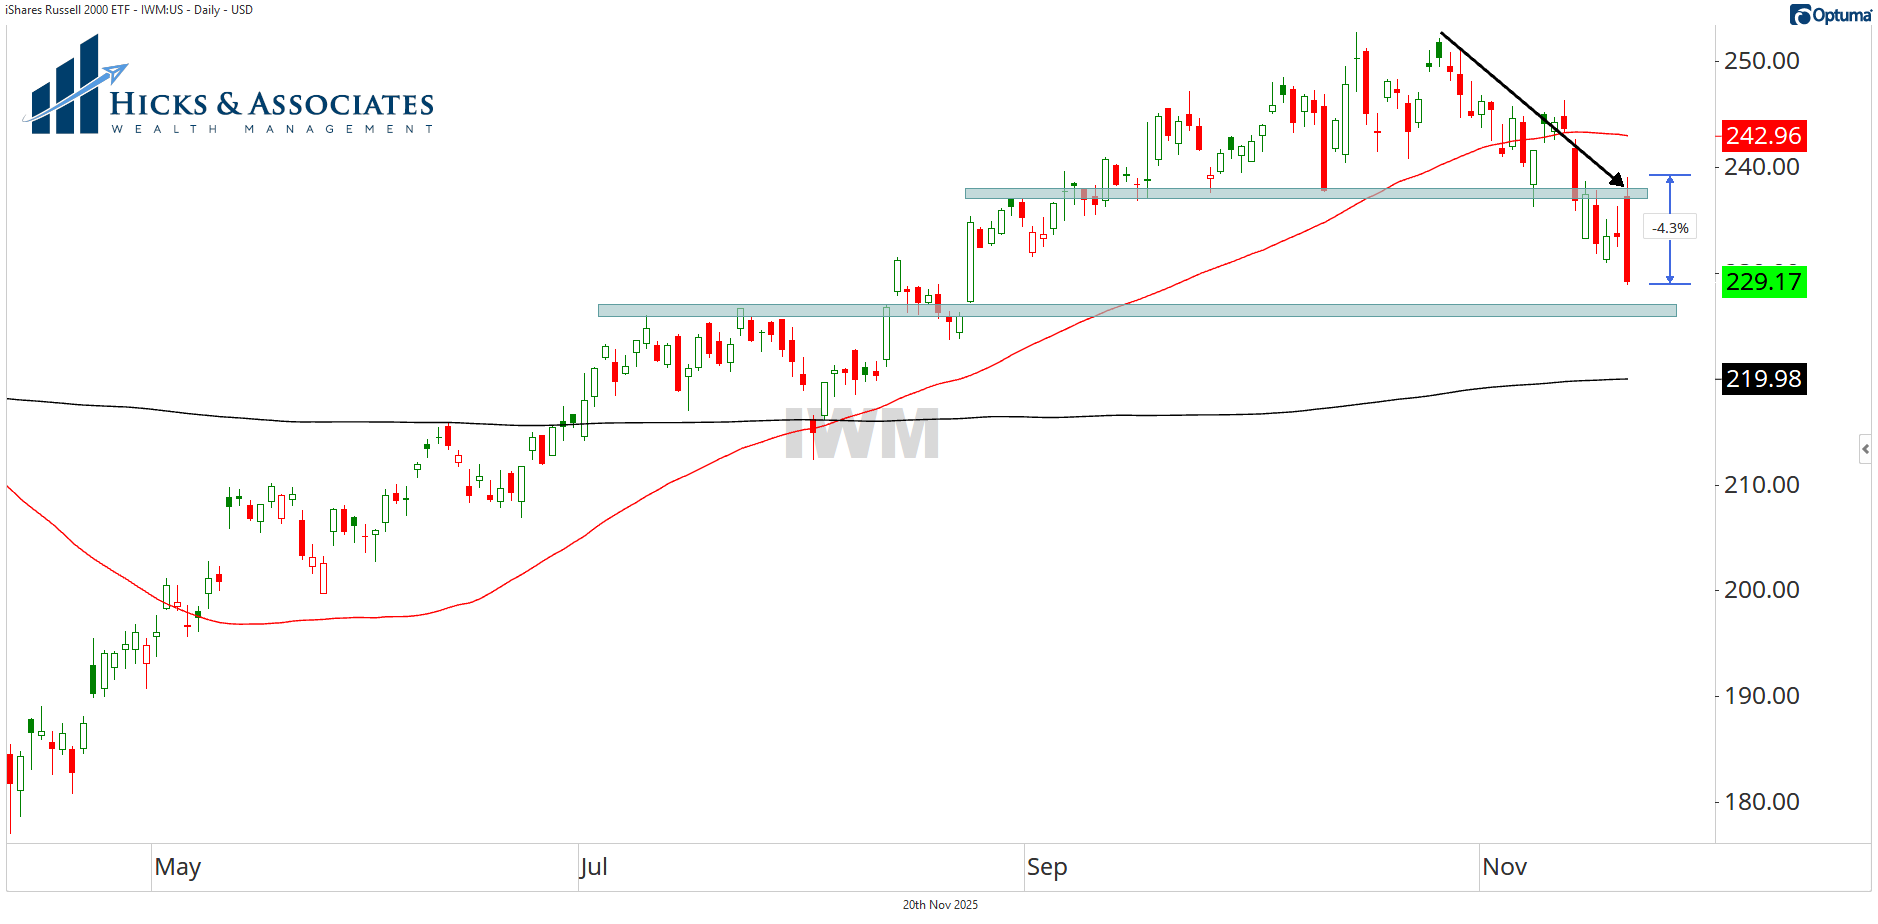
The small cap ETF, IWM, is our second chart. Note a couple of things. First, we now have six closes below the 50-day moving average. That’s a short-term downtrend.
Next, note that Thursday’s action attempted to get back above that level that I’ve highlighted with the blue-gray box. Not only could it not hold that level, but IWM printed a pretty bearish engulfing pattern. And it’s not far from what I would consider the next level of support (lower blue-gray box). And that support isn’t too far from the 200-day moving average. So, I will not be surprised if the 200-day gets tested next week.

Got Milk? Correlation?
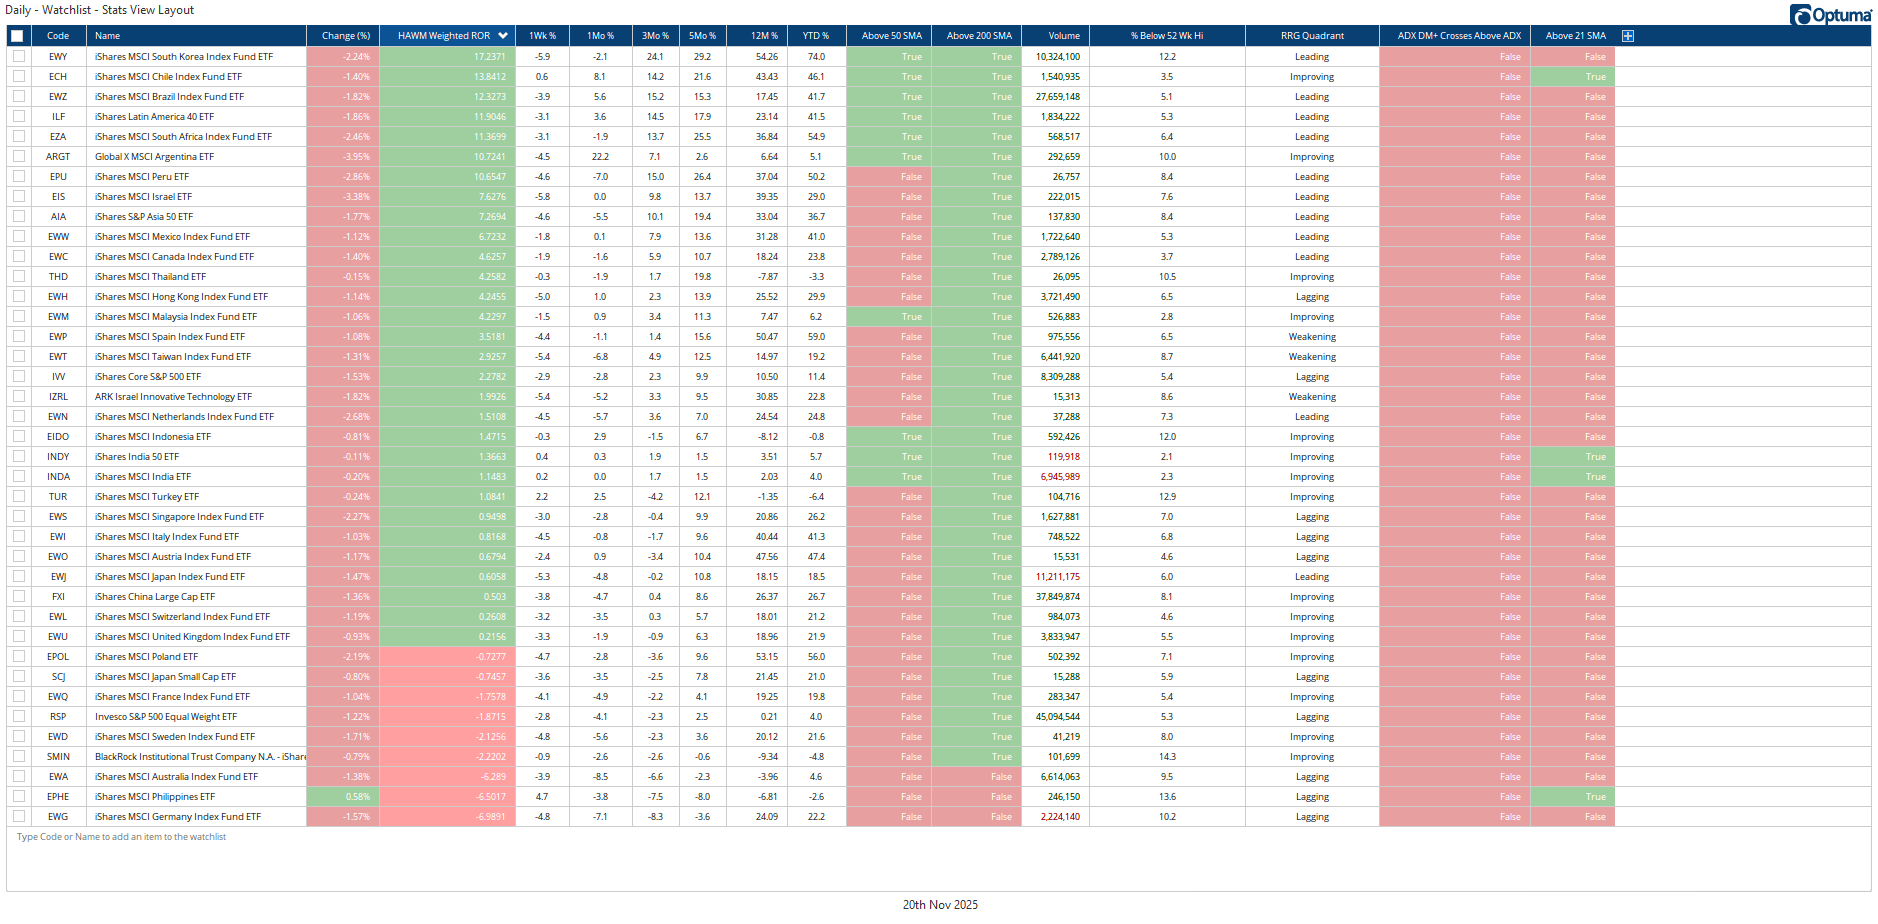
If you’ve read my book, this is a fantastic example of what I discussed on the concept of correlation and a key reason why Modern Portfolio Theory fails. You likely can’t read this table, and that’s okay ‘cuz you can clearly see my point by all that red in the third column from the left.
This is a table of Single-Country ETFs that I monitor. My theory is that clients are paying me to actively manage their wealth. So, if the U.S. is in a bear market, I want to try to find a bull market somewhere. The problem, as I discuss in my book, is that in bear markets correlation goes to one. In other words, in today’s highly integrated global economy, there is a high degree of correlation. According to this table, only the Phillippines were positive on Thursday.
[By the way, if you haven’t read my book … I mean, why not? Go get yourself a copy. I’ll be glad you did.🤣]
There’s a Time to Go Long, a Time to Go short, and a time to go…
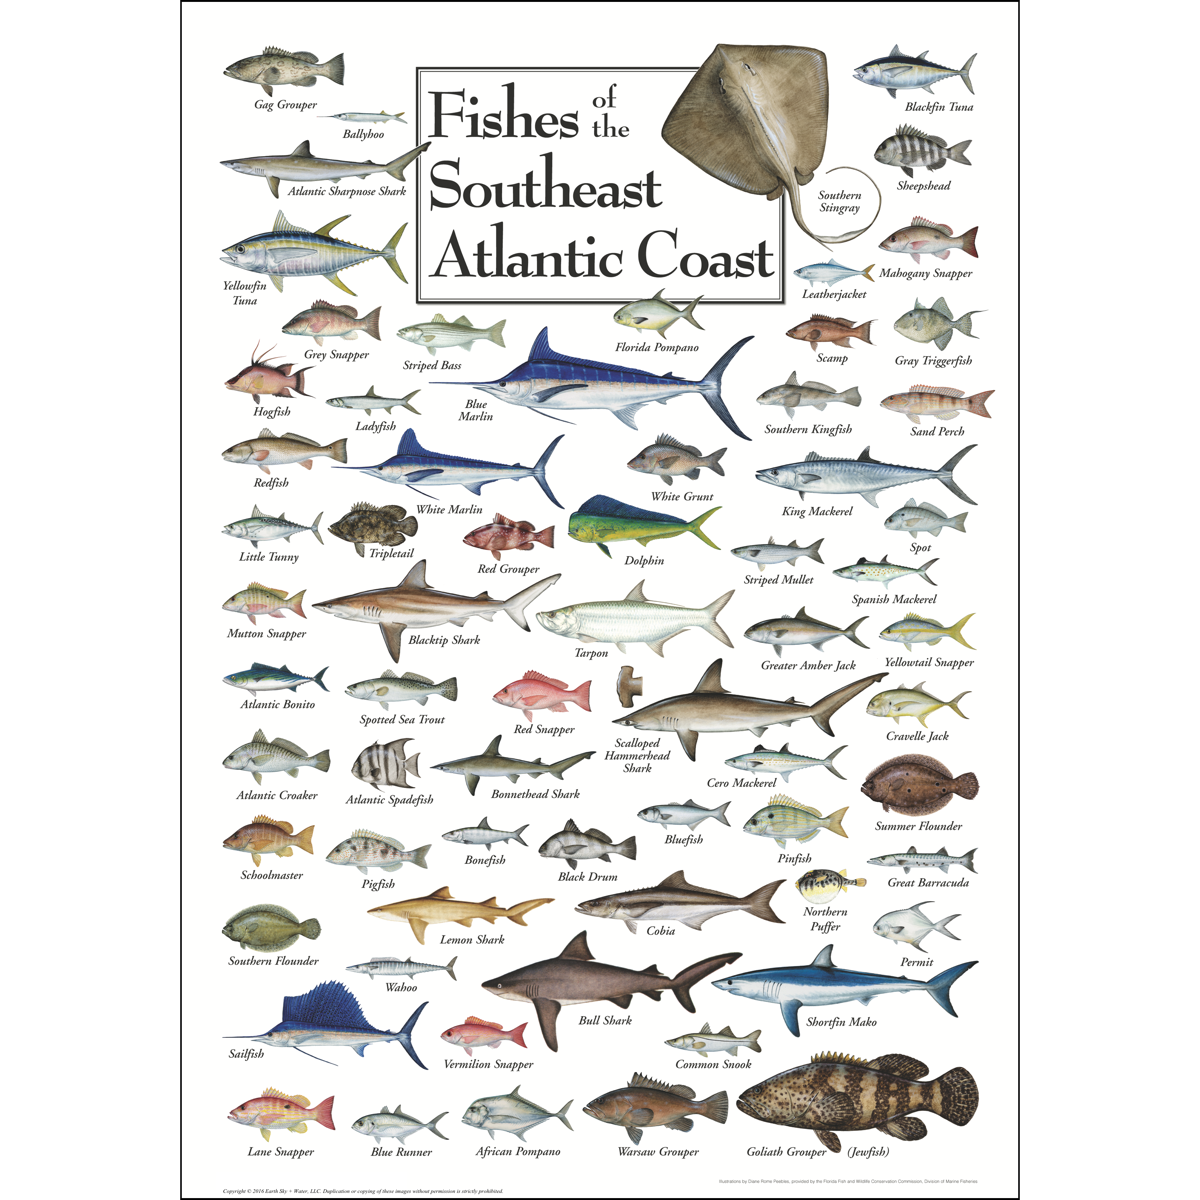
To quote the late great Jesse Livermore, “There’s a time to go long, a time to go short, and a time to go fishing.”
Since we might be in one of those times we should just go fishing, here’s a chart of fishes off the Southeast Atlantic Coast. Happy Thanksgiving.
Thanks for reading my content this week. Feel free to connect with me on LinkedIn.


Theodore Hicks II, CFP, CKA, CMT is the Founder, CEO & Chief Investment Officer of Hicks & Associates Wealth Management, an SEC registered investment advisor. Hicks’ rules-based asset management approach is focused on minimizing drawdowns while seeking to maximize gains. You can follow him on Twitter or LinkedIn.

Shared content and posted charts are intended to be used for informational and educational purposes only. CMT Association does not offer, and this information shall not be understood or construed as, financial advice or investment recommendations. The information provided is not a substitute for advice from an investment professional. CMT Association does not accept liability for any financial loss or damage our audience may incur.
