Investopedia is partnering with CMT Association on this newsletter. The contents of this newsletter are for informational and educational purposes only, however, and do not constitute investing advice. The guest authors, which may sell research to investors, and may trade or hold positions in securities mentioned herein do not represent the views of CMT Association or Investopedia. Please consult a financial advisor for investment recommendations and services.
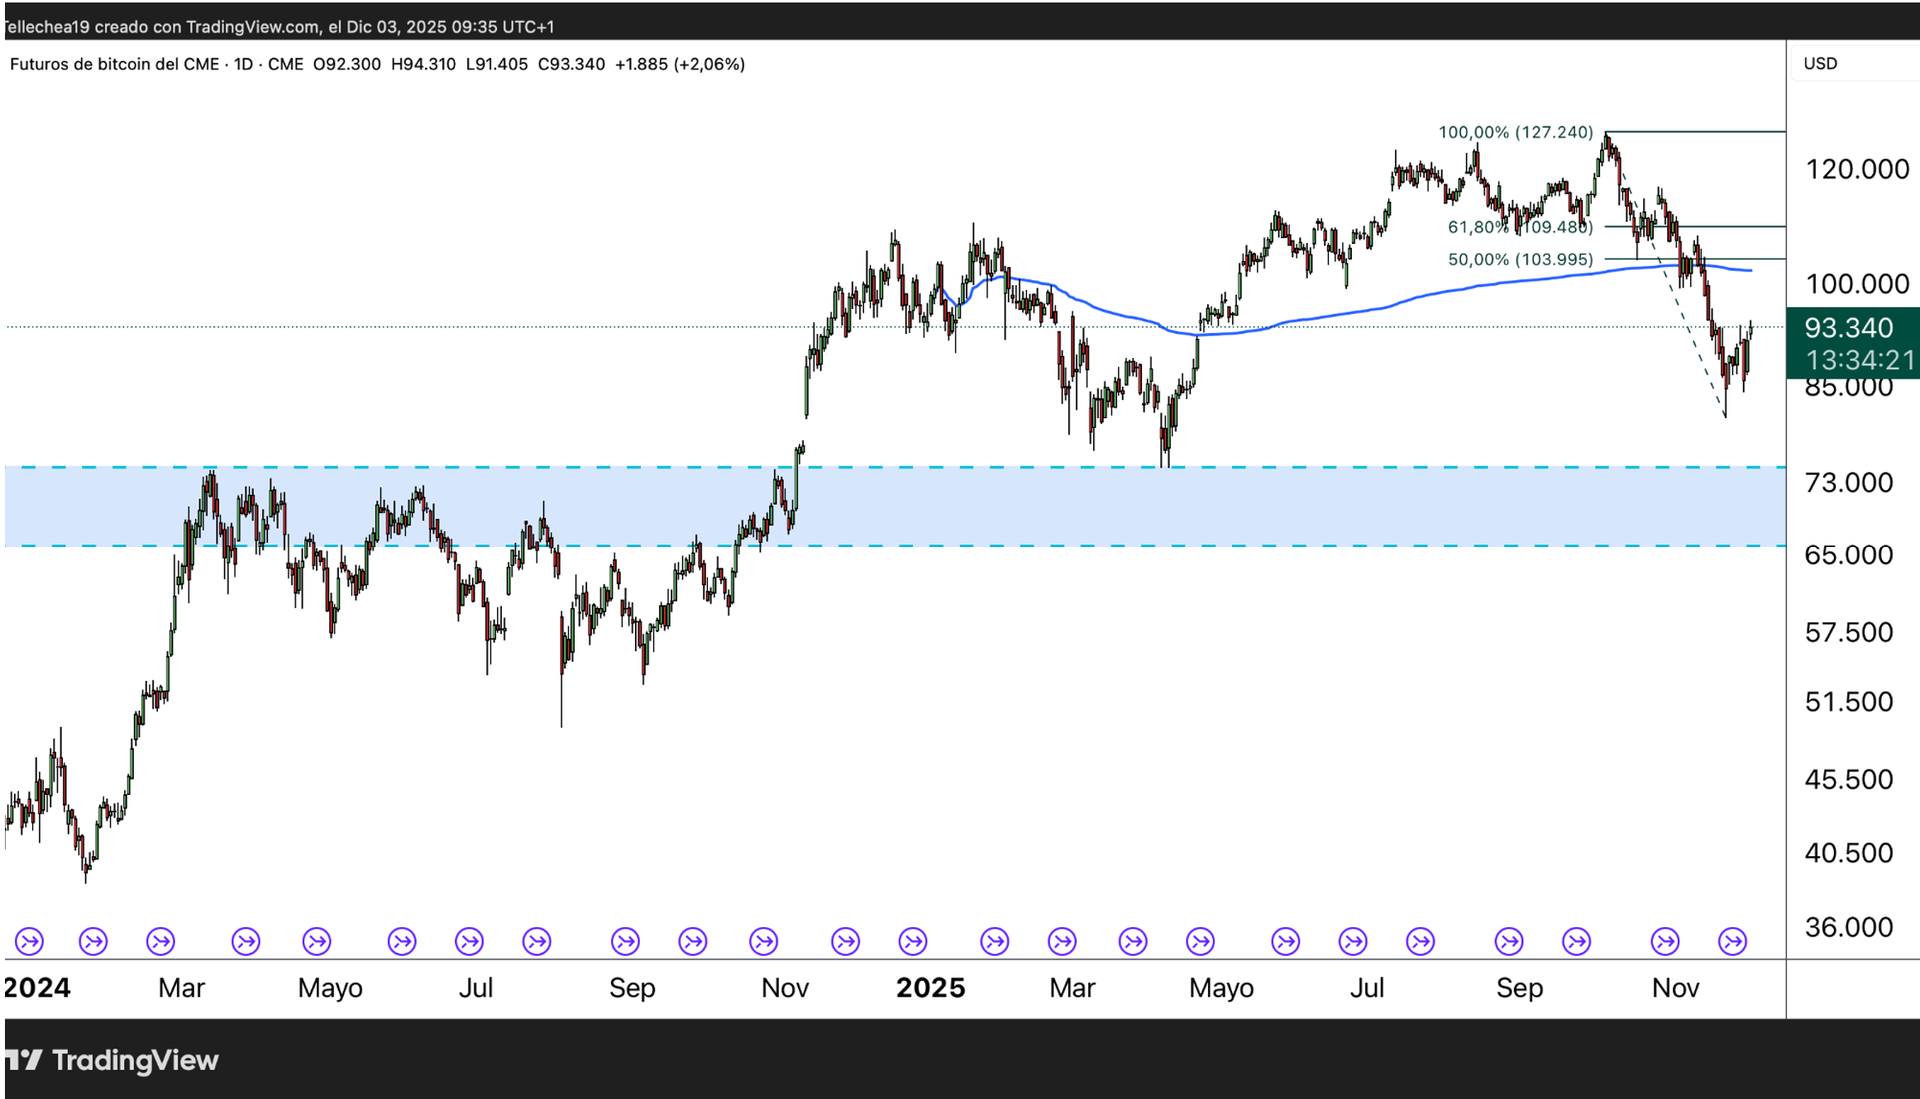
After a very strong rally over the past 4–5 months that pushed Bitcoin to a new all-time high, the market experienced a sharp selloff that produced a nearly 40% pullback. Now, price sits at a key decision point:
- If BTC breaks back above the $100–110k area with strong volume (where the annual VWAP is located), a new powerful bullish leg is very likely to follow.
- If, on the other hand, it fails to reclaim that zone and breaks below $80–82k, the door opens to a deeper correction toward $74k, where medium-term major support is found.
In any scenario, the broader trend remains bullish as long as BTC holds above the $80–82k area.

Have We Seen the Highs in Gold for 2025?
The recent sharp rebounds in precious metals reflect a deterioration in the real value of fiat currencies. Gold has consolidated itself as the second most important reserve asset among central banks, only behind the US dollar. In essence, the bull markets in metals remain intact, underscoring the loss of purchasing power of traditional currencies toward the end of October 2025.
Nevertheless, as prices continue to climb, the likelihood of periodic corrections increases. Such pullbacks can be significant in nominal terms, although still consistent with historical patterns. New highs call for caution: buying metals in the midst of a full bullish extension entails greater risks, while purchasing during phases of weakness has proven the most effective strategy in recent months and years.

Among the factors that could put pressure on gold in the coming months, the following stand out:
- High prices often contain their own corrective mechanism. Gold has risen from $252.50 in 1999 to nearly $4,400 per ounce at its most recent peak.
- Even the strongest bull markets rarely advance in a straight line.
- After nine consecutive quarters of new highs, long-term technical support lies well below current levels ($3,509.90 recorded in April 2025).
- The metal’s price is currently in a consolidation phase following the recent all-time high. However, the parabolic trajectory of the last two years, along with current prices, could result in an additional downward normalization process in the coming weeks or months.

The Gold/Bitcoin ratio is once again approaching a key resistance zone that has acted as a ceiling since 2024. After a very sharp upward move in recent weeks, the ratio has returned to the 0.10 level, coinciding with the area where gold buyers have historically lost traction relative to Bitcoin. Each approach to this zone has produced abrupt reversals in the past, underscoring its technical importance.
On the daily chart, the acceleration in the ratio suggests that gold has temporarily regained ground against Bitcoin. However, in the longer-term structure, the move since 2021 shows a dominant downward trend, implying that gold’s rallies versus BTC have been counter-trend bounces within a broader process of relative depreciation. The recent advance toward resistance also coincides with the defense of the 85,000–90,000 USD area in BTC, adding coherence to Bitcoin’s rebound against the metal.
What to watch now:
If the ratio rejects the 0.10 zone again—as it has repeatedly over the past few years—it could signal a renewed phase of relative strength for Bitcoin over gold. Conversely, a sustained breakout above that level—something not seen since 2022—would imply a structural shift in favor of the metal and add short-term pressure to cryptocurrencies. For now, this resistance remains the critical line separating a simple tactical rotation from a lasting trend reversal.

Japan’s Yields Break a Two-Decade Barrier
The yield on Japan’s 10-year government bond (JGB 10Y) continues to climb and is once again approaching the psychological and technical 2% level—a ceiling not seen since the early 2000s. This breakout represents one of the most significant structural shifts in the current global monetary policy cycle.
The ongoing uptrend confirms that Japan’s exit from its negative-rate regime was not an isolated event, but rather the beginning of a long-term adjustment in the country’s rate structure. Pressure on the Bank of Japan is increasing, as higher yields may force additional changes to its policy guidance.
What’s next?
If the JGB 10Y stabilizes above 2%, Japan’s monetary normalization could accelerate, with implications for the yen, global capital flows, and valuations of rate-sensitive assets. A rejection at this level would keep intact the range that has been in place since 2024.

Historical Summary
- 2007–2015: Yields fluctuated between 1.5% and 1.8% — a normal range for Japan.
- 2016–2021: The BoJ launched Yield Curve Control (YCC) and forced the 10Y to stay near 0% (even negative between 2016–2019).
- 2022–July 2024: First major upward cycle. The BoJ began loosening YCC and the yield climbed to ~1.50% (the highest level in more than a decade).
- July 2024–July 2025: Sharp decline back to roughly 0.30 — 0.40% (driven by global recession fears + a massive unwind of yen carry trades in summer 2025).
- August–Dec 3, 2025: Another explosive move higher from 0.40% to 1.998% today (the highest since 2007).
Why This Matters (and Why Yields Are Surging Now)
- The new BoJ Governor, Ueda, is normalizing monetary policy faster than expected.
- Japan’s real inflation has remained above 2% for several consecutive quarters → the BoJ can no longer justify negative or zero rates.
- Japan is slowly dismantling YCC → the market is already pricing in official rate hikes in 2026 (potentially up to 0.50 — 0.75%).
- Global domino effect: when the JGB 10Y rises, the yen carry trade unwinds → yen strengthens → tech stocks and crypto come under pressure → global volatility increases.
Outlook for the Coming Days/Weeks
- The Japanese bond market is experiencing its most intense stress point in the past 20 years.
- The 2% level is acting like a magnet. It is highly likely to be tested (or even marginally exceeded) before year-end.
- If the BoJ does not intervene verbally or through large-scale purchases, a clean break above 2% could trigger another wave of carry-trade unwinding and heightened volatility in equities and crypto.
Japan’s 10-year bond is undergoing its most critical moment since the subprime crisis. What happens around the 2% level over the next 5–10 trading sessions will carry significant global implications.


Manuel Tellechea, CMT has been affiliated with the CMT Association since 2021 and has been an avid contributor to the CMT community. He currently holds the position of Senior Analyst at Bendio AG, where he actively contributes to quantitative analysis and strategic decision-making processes. To learn more about his work, visit https://www.bendio.ch or follow Manuel on Twitter at @tellechea19.
Shared content and posted charts are intended to be used for informational and educational purposes only. CMT Association does not offer, and this information shall not be understood or construed as, financial advice or investment recommendations. The information provided is not a substitute for advice from an investment professional. CMT Association does not accept liability for any financial loss or damage our audience may incur.
