1/ Where Else but Industrials?
Small cap Industrials continue to perform extremely well on both an absolute and relative basis. They’re the only small cap sector displaying a positive year-to-date return. The outperformance can be attributed to several key factors. Small cap industrials are highly sensitive to economic cycles, often benefitting significantly during periods of growth. As infrastructure spending rises and reshoring efforts gain momentum, these companies are well-positioned to capitalize on localized shifts and increased demand for industrial goods.
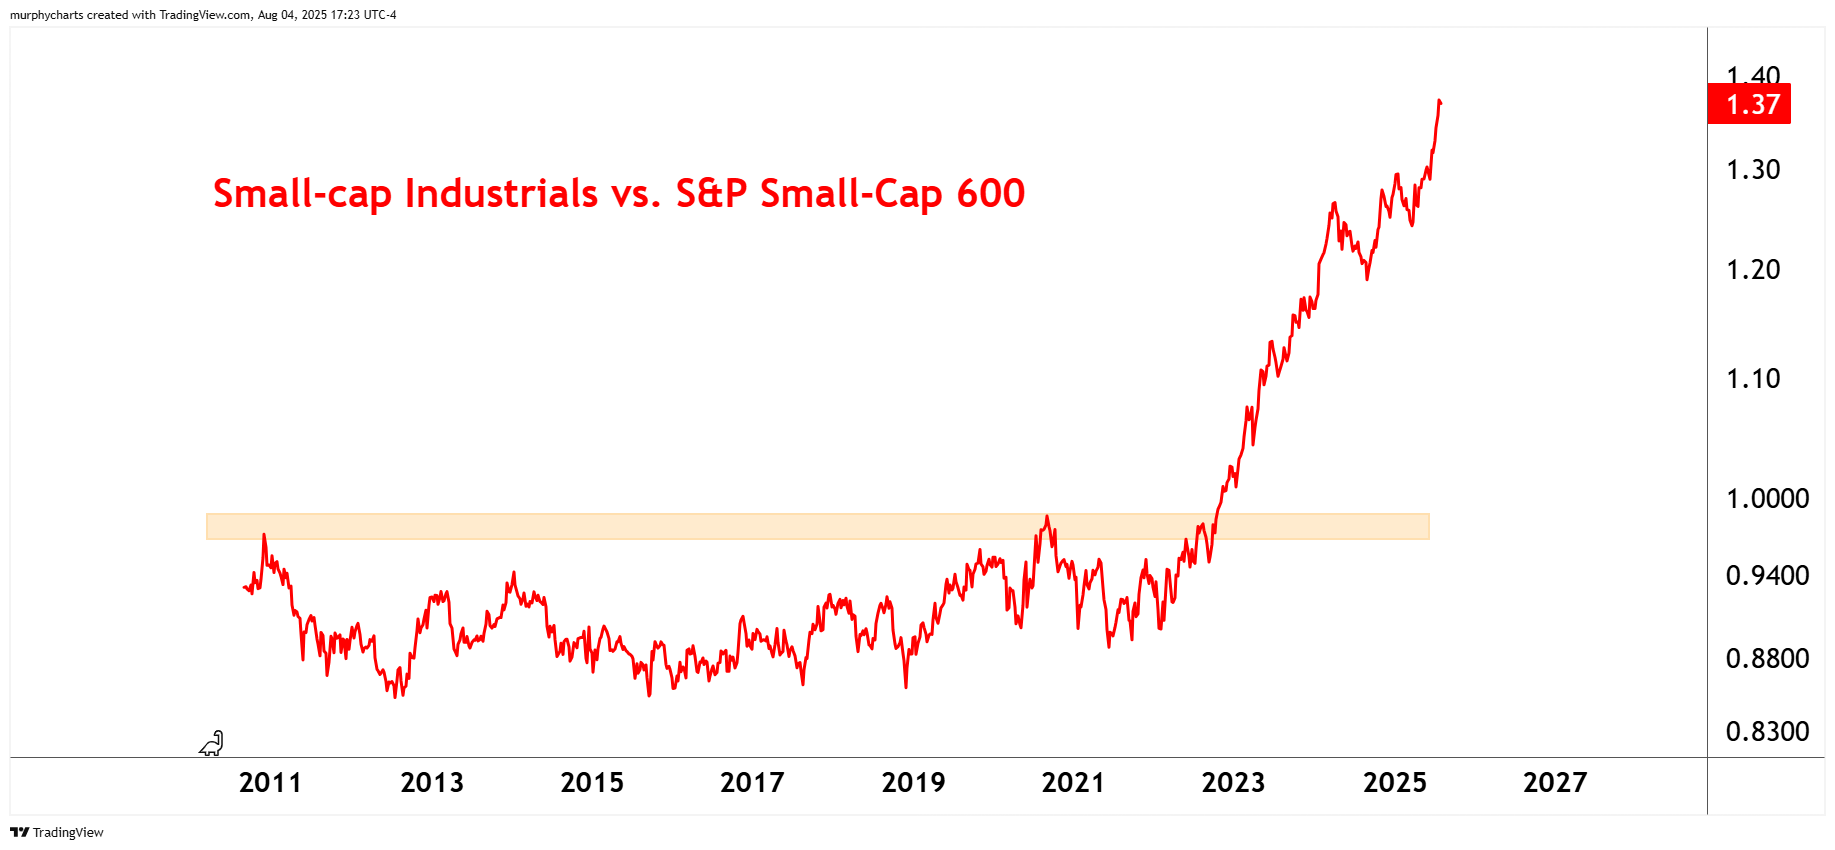
The mega-trend that is US Infrastructure continues to garner investor attention. If Small cap Industrials are forming new price highs – it’s difficult to envision the US economy entering a period of broad decline!
2/ Small Caps Fill the Gap
The Russell 2000 small-cap index closed below its 200-day average on Friday 8/1, after a 20-point opening gap lower. By the close of Monday’s trading, buyers filled the gap pushing prices back above Thursday’s closing price.
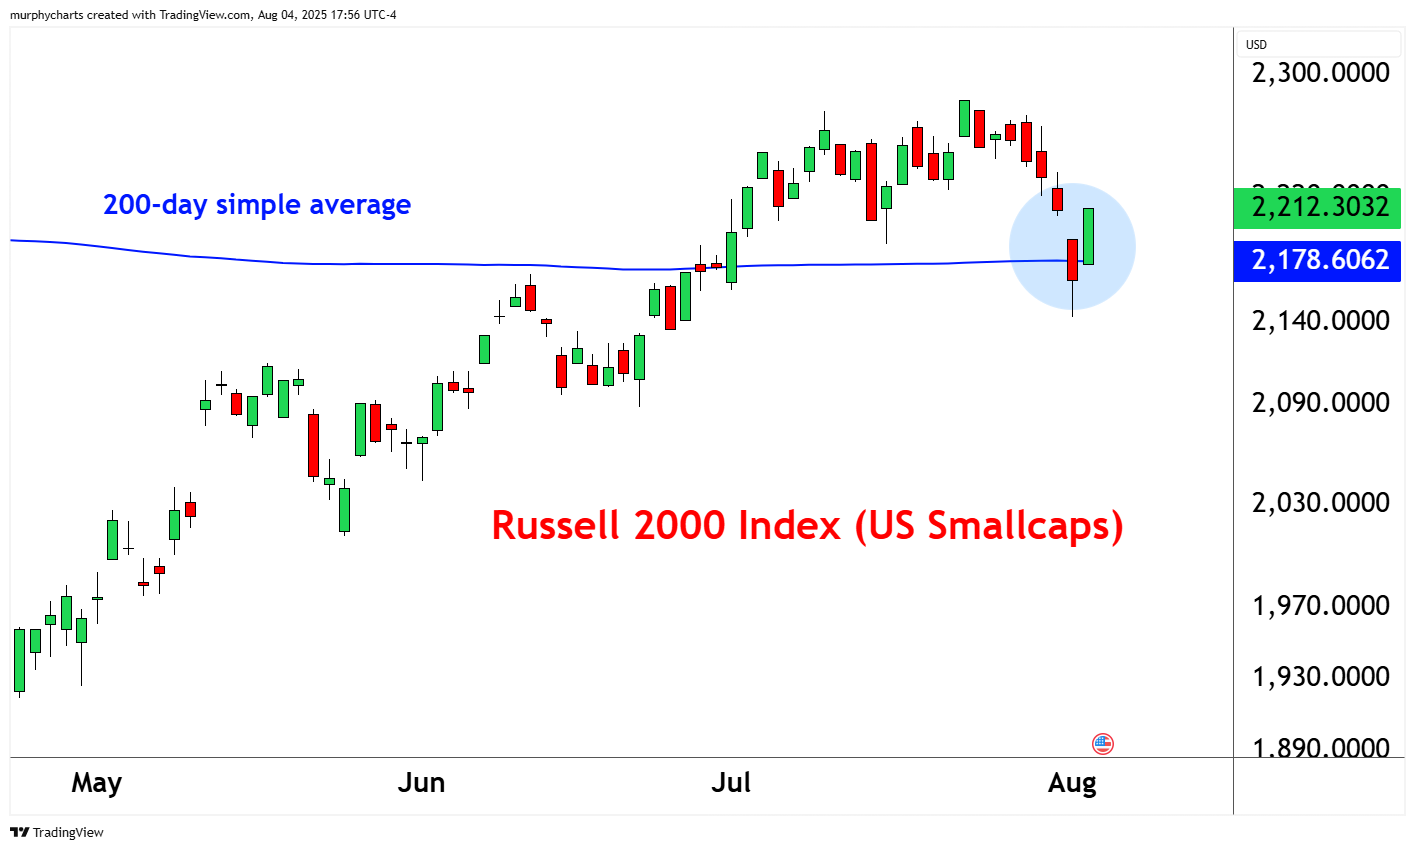
The gap fill points to short-term market resilience, as traders seemed eager to buy the dip and push prices back toward prior levels. All of this took place just above a flat 200-day simple average. The 2,200 level on the index remains an important psychological level – it’s behaved as both support and resistance over the last 12-months and is now becoming an area of real confluence!
3/ US Dollar Index at Resistance
The US Dollar Index continues to trade below a well-tested support/resistance zone ~100. The decline in the dollar has aided international equity funds that are denominated in USD. If the downtrend continues, it will provide a major tailwind to the category.
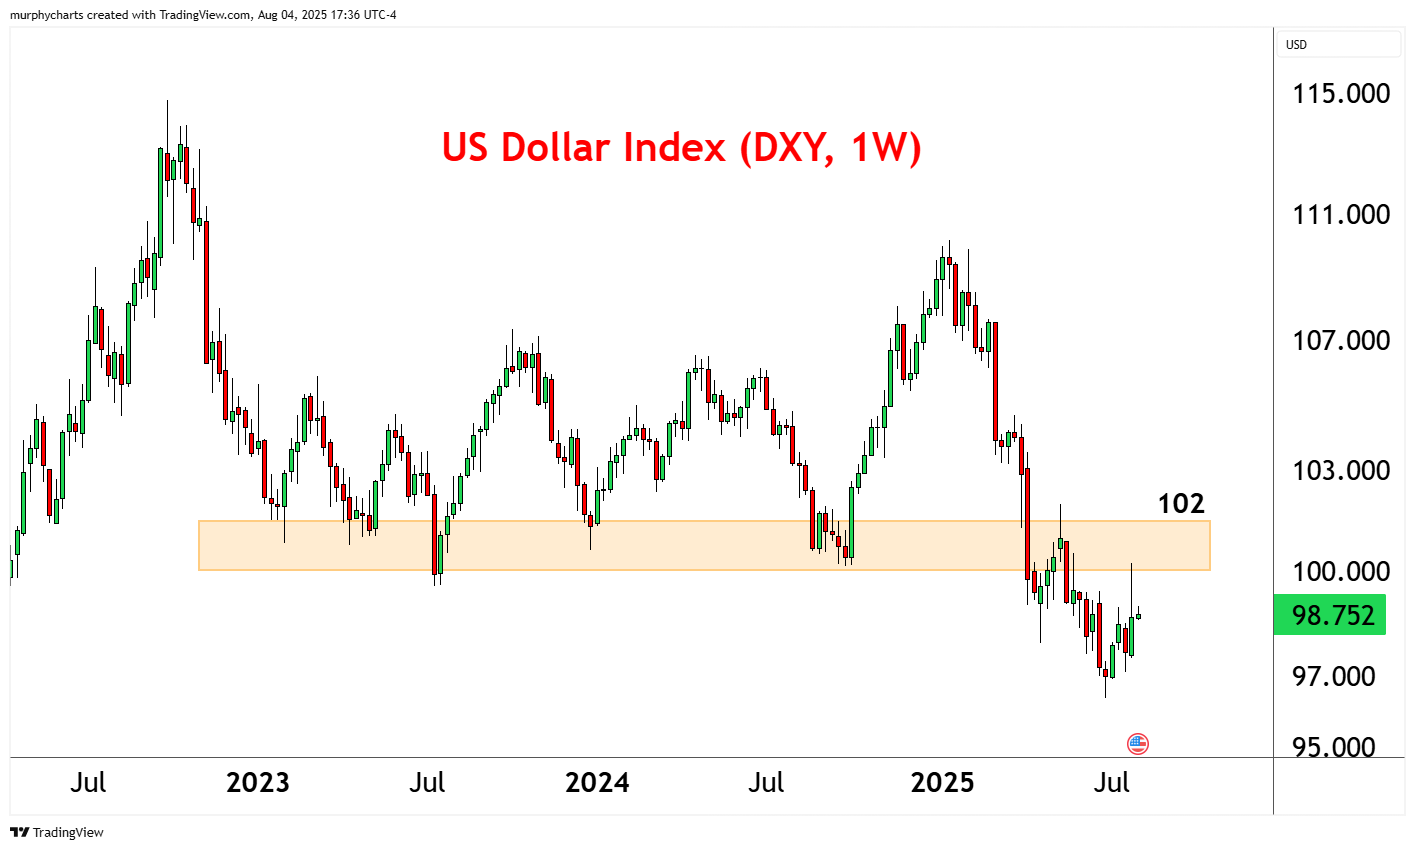
The dollar witnessed a touch of mean reversion to kick of H2. But is struggling to make its way through this well-tested supply zone. Traders are using this level to define both risk and trend. How it will resolve is anyone’s guess – but the defined price level brings me comfort as a technician! How else are we to develop a view and manage risk/expectations?
Shared content and posted charts are intended to be used for informational and educational purposes only. CMT Association does not offer, and this information shall not be understood or construed as, financial advice or investment recommendations. The information provided is not a substitute for advice from an investment professional. CMT Association does not accept liability for any financial loss or damage our audience may incur.
