1/ Improving Breadth Suggests Healthy Participation
Breadth conditions have been mixed in July, with the McClellan Oscillator notably still below the zero level for the last two weeks. But with about 65% of the S&P 500 members above their 200-day moving averages, I would consider breadth fairly healthy going into August.
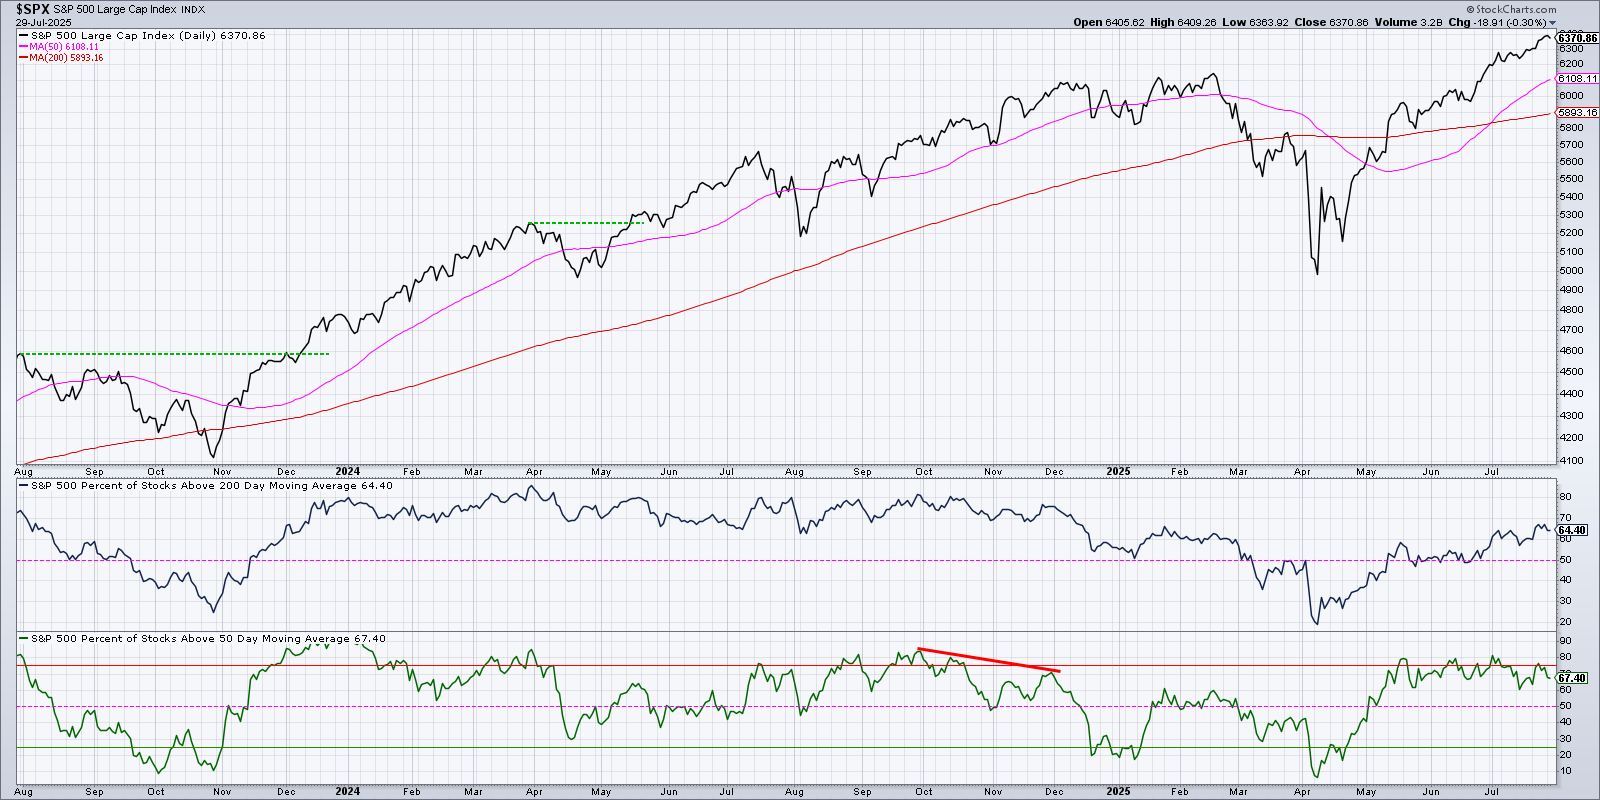
About six weeks ago in mid-June, it was literally a coin flip with 50% of the S&P 500 stocks above their 200-day moving average. Over the subsequent six weeks that number has pushed up to around 65%, implying that about 15% of the index members have regained their 200-day moving average.
With well over 50% of the S&P 500 stocks above their 200-day moving average, and about two thirds of the index members above their 50-day moving average, it appears that most of the index is in decent shape using this basic measure of trend. As long as at least 50% of the index remains above their 50-day moving average, we’d consider this chart to be in a clearly bullish range.
2/ Which Way Will the Brewer Break?
Next we’ll break down two Seattle area companies reporting earnings over the last week, with a focus on technical implications and key levels to watch. First it’s coffee conglomerate Starbucks Corp., which has been decidedly sideways since mid-June.
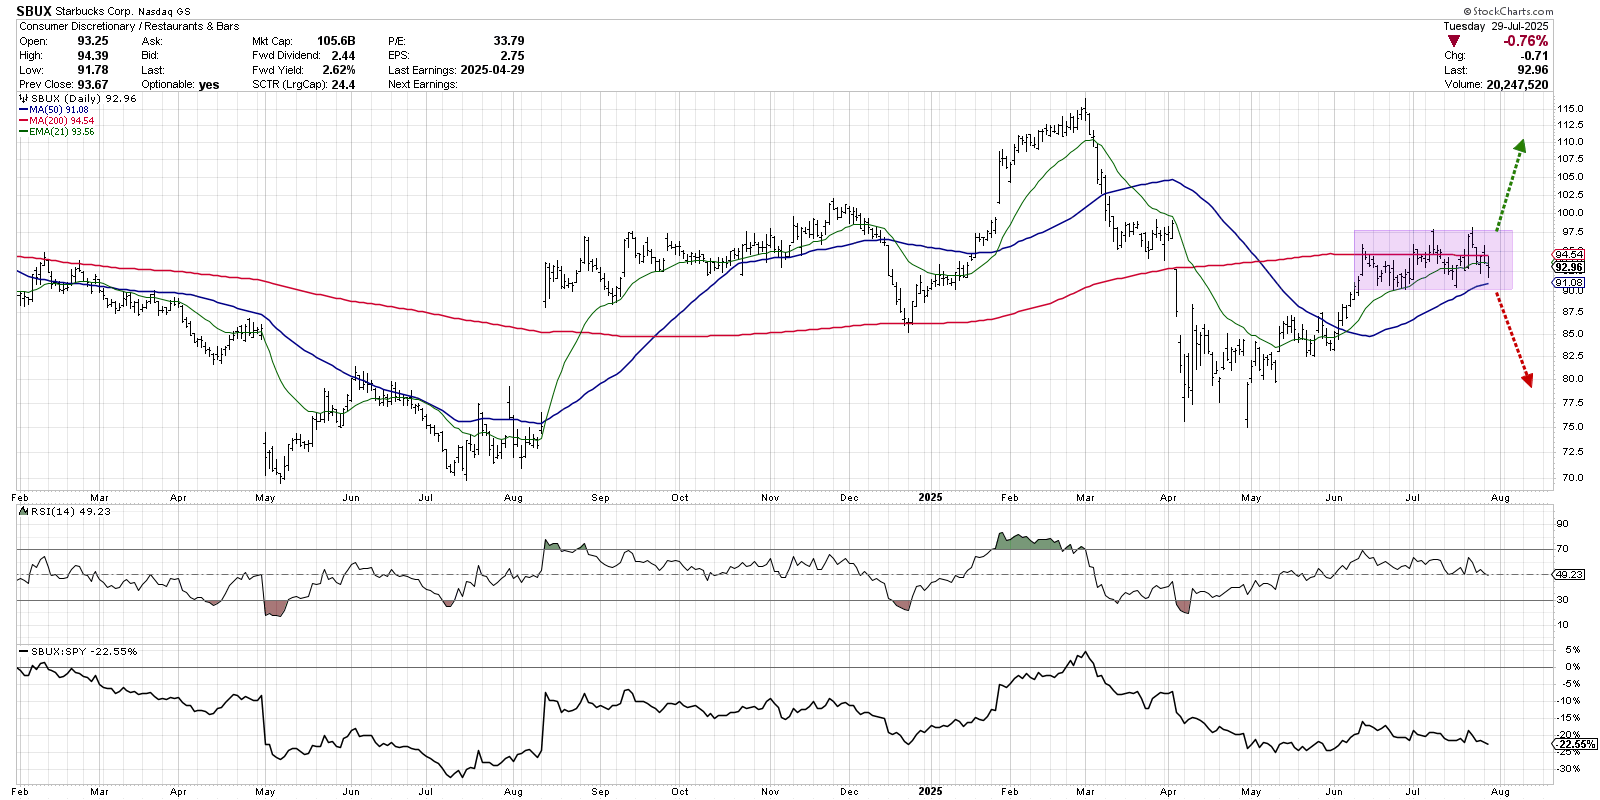
I tend to define any chart as in one of three phases: an accumulation phase of higher highs and higher lows, a distribution phase of lower lows and lower highs, or a consolidation phase of consistent highs and lows. Starbucks provides a perfect illustration of a chart in a consolidation phase, with clear support around $90 and consistent resistance around $98.
Legendary trader Jesse Livermore is quoted as saying, “There is time to go long, time to go short, and time to go fishing.” In the case of SBUX, it definitely feels like “fishing time” until the price breaks out of that sideways price pattern. A break above $98 would suggest a potential retest of the February peak. A drop below $90 would also mean a failure of the 50-day moving average, implying a retest of the April lows.
3/ Alaska Faces a Confluence of Resistance
Alaska Air Group (ALK) is the largest airline operating at Seattle-Tacoma International Airport, and similar to our local coffee chain described above, the stock remains rangebound and waiting for a catalyst to break out of this consolidation phase.
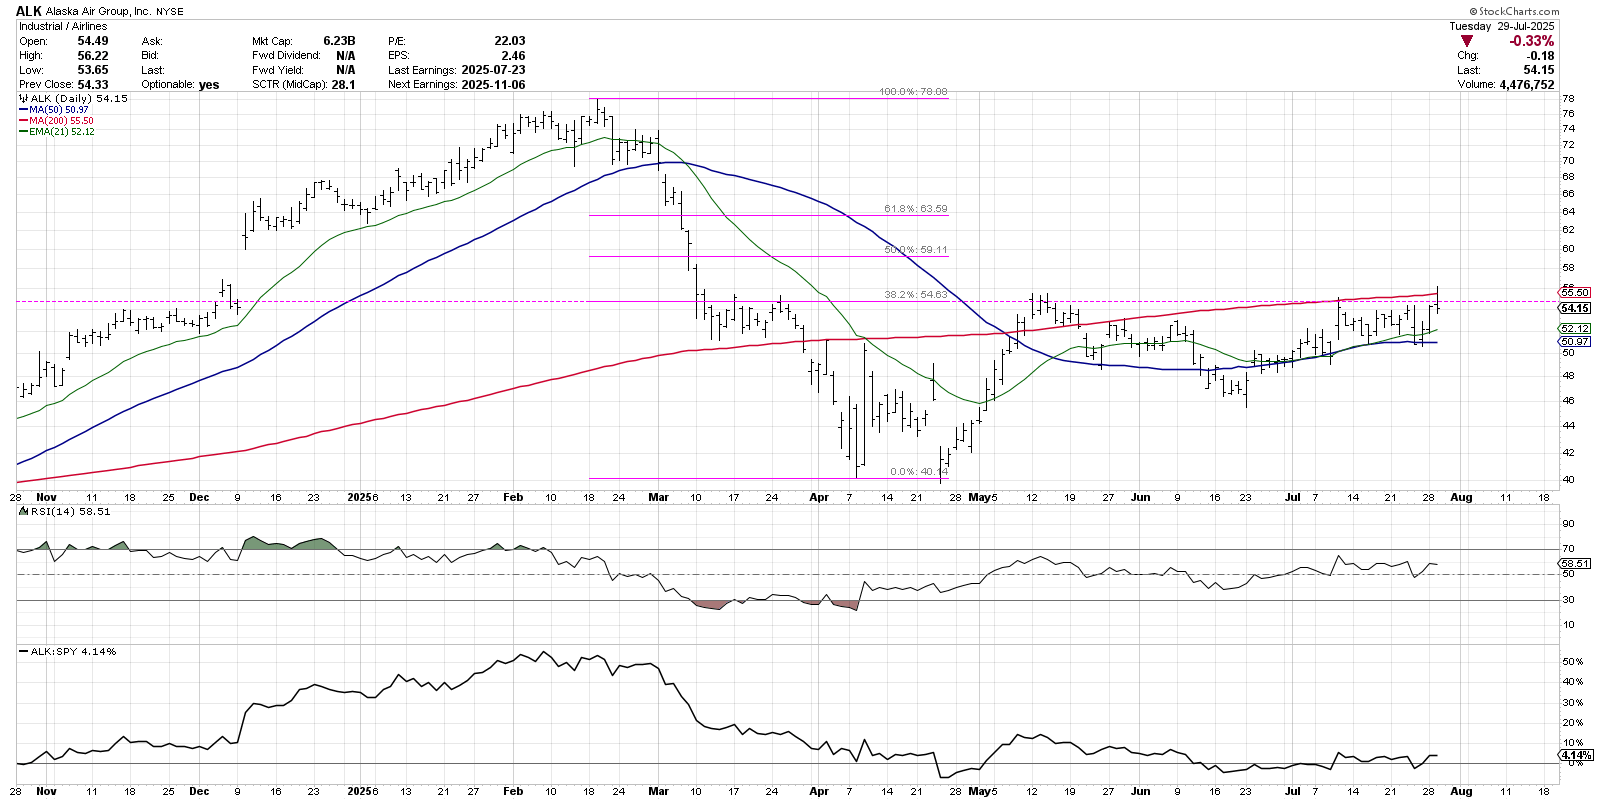
Alaska is currently sitting just below what’s called a “confluence of resistance”, where a series of technical indicators all coalesce around the same price level. We can see that the 200-day moving average, the 38.2% Fibonacci retracement level, and highs from May and July are all right around $55.
As long as ALK remains below resistance, and the Relative Strength Index (RSI) remains in a quite neutral range between 40 and 60, we’re inclined to remain on the sidelines. But a valid breakout above this $55 level, supported by stronger momentum in the form of RSI pushing above 60, would confirm a new accumulation phase for this mid-tier US airline.
Amateurs buy charts and hope that the price does what they expect it to do. Experts know that “hope” is a four-letter word for investors, and instead they set a game plan based on the established principles of technical analysis!
Shared content and posted charts are intended to be used for informational and educational purposes only. CMT Association does not offer, and this information shall not be understood or construed as, financial advice or investment recommendations. The information provided is not a substitute for advice from an investment professional. CMT Association does not accept liability for any financial loss or damage our audience may incur.
