By Todd Stankiewicz, CMT, CFP, ChFC with SYKON Capital
| Investopedia is partnering with CMT Association on this newsletter. The contents of this newsletter are for informational and educational purposes only, however, and do not constitute investing advice. The guest authors, which may sell research to investors, and may trade or hold positions in securities mentioned herein do not represent the views of CMT Association or Investopedia. Please consult a financial advisor for investment recommendations and services. |
1/ 10-Year Treasury Yield: A Coiling Pattern at Critical Support
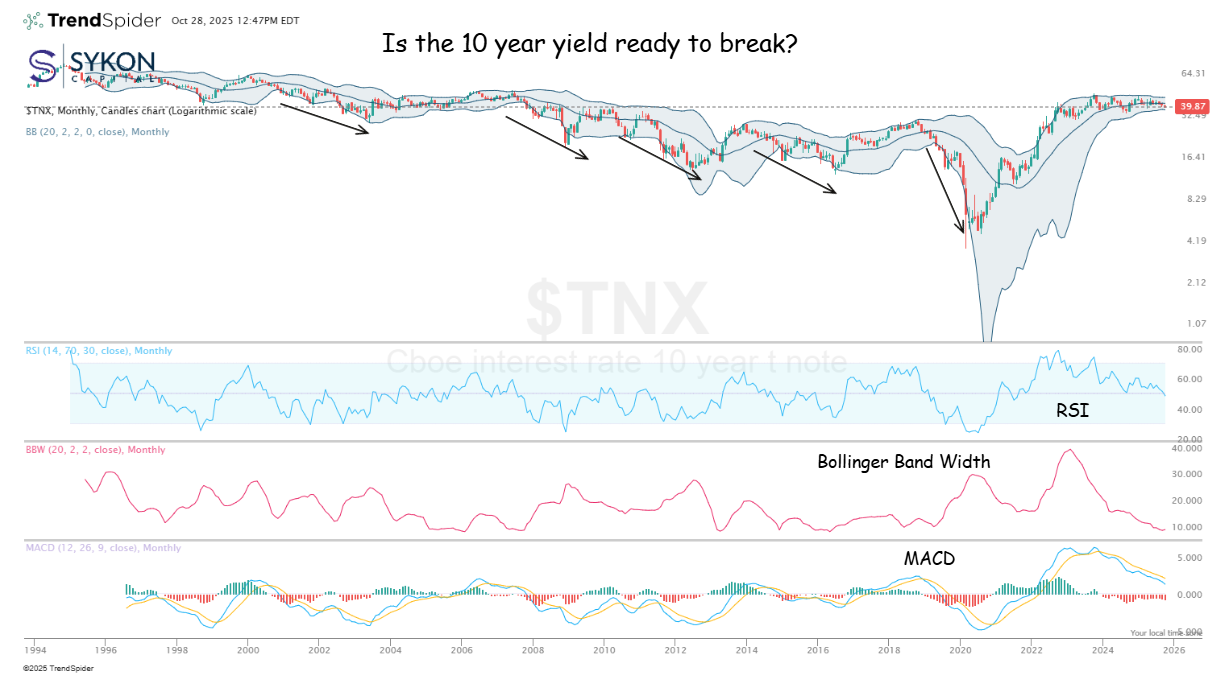
As the Federal Reserve prepares to announce its widely expected 25 basis point rate cut today, the 10-year Treasury yield is exhibiting a textbook compression pattern that warrants close attention from investors.
The 10-year yield has been coiling tighter over the past six months, with monthly trading ranges contracting significantly since May’s spike to 46.29 (using TNX notation where yields are quoted in tenths). October’s range has compressed to just 2.24 points (39.47-41.71), down from May’s 5.05-point range, a clear sign of volatility compression that typically precedes a significant directional move.
Currently trading near 39.91, the yield is testing critical support at the 39.47-39.92 zone. This level has held multiple tests in recent months, but the persistent coiling action at support raises an important technical question: which way will it break?
Historical analysis of similar compression patterns offers valuable perspective. When yields have coiled at support levels following a decline, as we’re seeing now after the January 2025 peak at 48.09, the resolution has more frequently been to the downside. Notable precedents include the mid-2019 compression that preceded a sharp decline, and the early 2020 pattern that resolved violently lower.
However, investors should remember that compressed volatility can unleash moves in either direction. The 2017-2018 compression, though less common, resulted in a sharp upside breakout that caught many off guard.
The technical setup is straightforward: a break below 39.47 would likely target the September 2024 low at 36.03, representing a potential 9% decline in yields, a significantly bullish scenario for bond prices and potentially equities. Conversely, a breakout above the 44-47 resistance zone would signal a continuation of the higher-yield regime.
aAWith the Fed beginning its easing cycle amid persistent inflation concerns, the 10-year yield’s resolution from this coiling pattern could provide important signals about market expectations for the economic trajectory ahead. The coming weeks will reveal whether this compression breaks in favor of the bond bulls or yields resume their climb.
2/ Falling Yields and Stocks: Two Very Different Stories
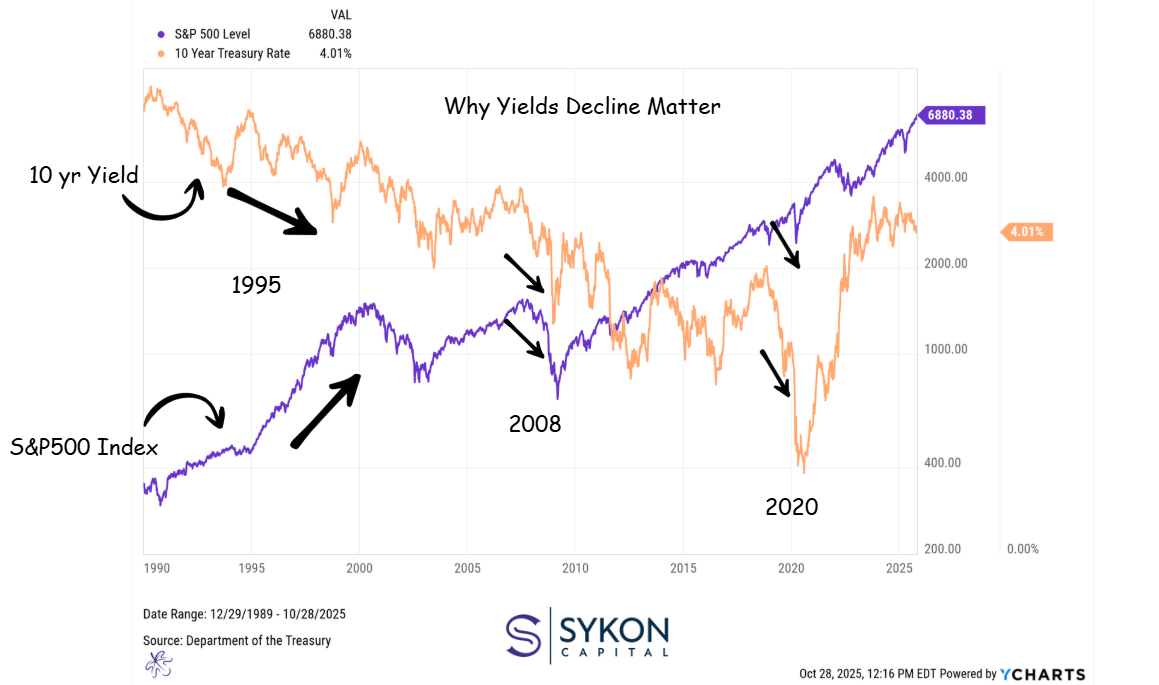
In my previous post, I explained why I believe 10-year Treasury yield may be headed lower after a consolidation. But here’s the critical question: What does that mean for the S&P 500?
History shows falling yields can either fuel explosive equity rallies or signal devastating bear markets. The difference comes down to one factor: WHY are yields falling?
Since 1970, the Fed has initiated eleven rate-cutting cycles, with the S&P 500 delivering a median return of 11.9% over the following 12 months. But outcomes varied wildly, from a 41% rise to a 24% decline. When you separate cycles by economic outcome, two distinct patterns emerge:
Scenario 1: “Good” Falling Yields (Soft Landing) In cycles where the economy avoided recession, the S&P 500 averaged 21% returns. The 1995 cycle delivered roughly a 30% gain, with the market starting near all-time highs, similar to today. This was also reminiscent of 1985.
Scenario 2: “Bad” Falling Yields (Recession) When rate cuts failed to prevent recession, outcomes turned dark. The 2007-2008 cycle saw the Fed cut 500 basis points, yet the S&P 500 plummeted 40% as 10-year yields crashed 222 basis points. In March 2020, the S&P 500 dropped 21% despite emergency rate cuts. These were flight-to-safety moves, not bullish recalibrations.
If 10-year yields break below 4.0% and crash toward 3.3-3.6%, the interpretation depends entirely on context:
Gradual decline + resilient earnings + contained credit spreads = Scenario 1 (bullish)
Rapid crash + deteriorating data + widening spreads = Scenario 2 (bearish)
With the S&P 500 near all-time highs and the soft landing largely priced in, a dramatic yield crash from current levels would more likely signal recession than Fed pivot optimism.
The “falling yields = stocks rally” narrative only works when markets believe it’s a controlled landing. When yields crash because the economy is imploding, stocks don’t care about lower discount rates, they care about collapsing earnings.
Watch the pace of yield movements, corporate earnings trends, and credit spreads. They’ll tell you which scenario is unfolding.
3/ Why Credit Spreads Matter Now
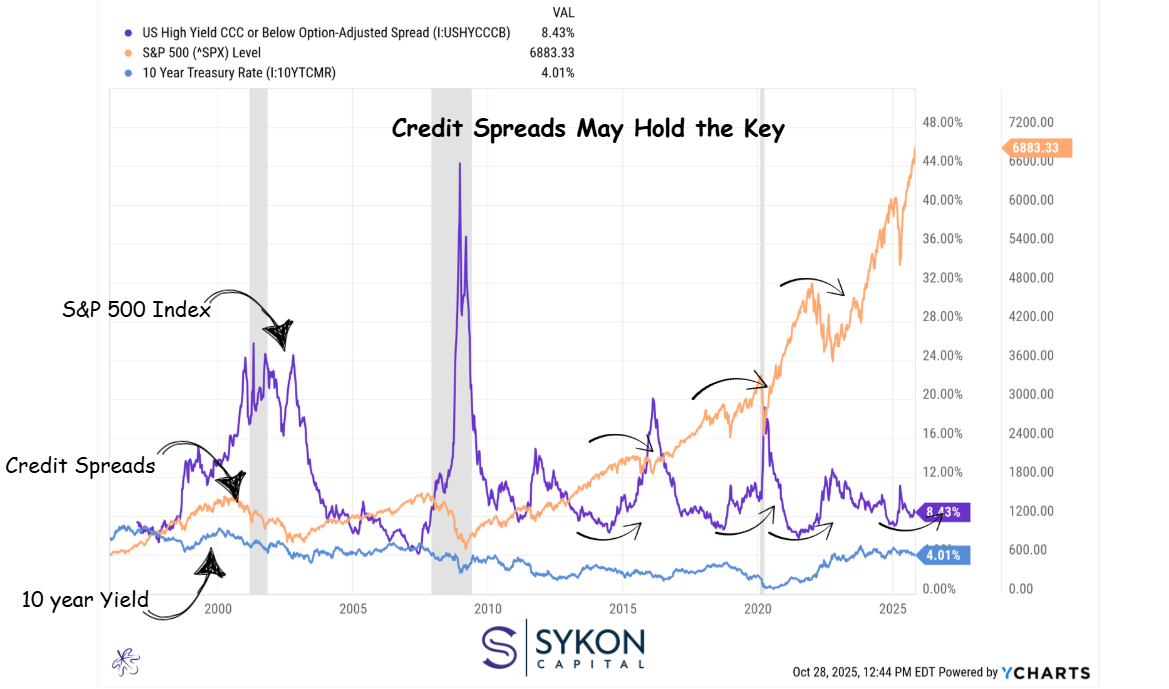
One of the most reliable indicators for assessing market risk scenarios is the behavior of credit spreads. When credit spreads widen, markets demonstrate heightened sensitivity to risk. While we’ve historically operated in a relatively tight credit spread environment, a concerning divergence has emerged: CCC and below high-yield credit spreads are widening significantly more than higher-quality BB spreads.
The accompanying chart overlays CCC-or-below option-adjusted credit spreads (orange line) against the S&P 500 (purple line) and the 10-year Treasury yield (blue line). This visualization reveals a historically consistent pattern: when credit spreads widen while Treasury rates decline, equity markets typically experience downward pressure. This correlation has held remarkably steady since the data series began in 1996, with widening spreads during declining yields consistently preceding or accompanying equity market weakness. The gray-shaded recession periods on the chart underscore how extreme credit spread widening often signals broader economic deterioration.
This analysis is particularly timely given recent market discussions surrounding private credit. There’s growing concern that private credit may be distorting observable credit spreads, making conditions appear tighter than underlying fundamentals suggest. Unlike publicly traded credit instruments, private credit positions aren’t priced daily or transparently. This opacity means the credit spreads we monitor may not fully capture deteriorating credit conditions in the private markets.
Additionally, many private credit vehicles utilize smaller, less established credit rating agencies rather than major agencies like Moody’s or S&P. Market speculation suggests these alternative raters may be mispricing or misgrading risk, potentially masking credit quality deterioration that would otherwise be reflected in wider spreads.
As we evaluate potential scenarios for Treasury yields and equity market direction, high-yield credit spreads, particularly the CCC segment, provide critical insight into risk appetite and economic trajectory. The current divergence between lower-quality and higher-quality spreads, combined with potential private credit distortions, warrants close monitoring as a leading indicator for equities, Treasuries, and broader economic conditions.


Todd Stankiewicz CMT, CFP, ChFC is the President and Chief Investment Officer of Harrison, N.Y. based SYKON Capital, where he manages portfolios for private clients, financial advisors and institutions focused on minimizing downside risk. He is also the Portfolio Manager of the Free Markets ETF (Ticker: FMKT). A member of the CMT Association since 2018, Todd has been a guest author for Chart Advisor since 2023. Learn more at www.SYKONCapital.com.
Advisory Services offered through SYKON Capital LLC, a registered investment advisor with the U.S. Securities and Exchange Commission. This material is intended for informational purposes only. It should not be construed as legal or tax advice and is not intended to replace the advice of a qualified attorney or tax advisor. The information contained in this presentation has been compiled from third party sources and is believed to be reliable as of the date of this report. Past performance is not indicative of future returns and diversification neither assures a profit nor guarantees against loss in a declining market. Investments involve risk and are not guaranteed.

Shared content and posted charts are intended to be used for informational and educational purposes only. CMT Association does not offer, and this information shall not be understood or construed as, financial advice or investment recommendations. The information provided is not a substitute for advice from an investment professional. CMT Association does not accept liability for any financial loss or damage our audience may incur.
